Bitcoin Roars Back Into Profit As Greed Flares Up – $200K Rally Still in Play?

Bitcoin bulls are back in the driver's seat as the crypto giant flips into profit territory again. Market sentiment? Pure greed – but that hasn't stopped speculators from eyeing a moonshot to $200,000.
The Fear & Greed Index is flashing warning signs, yet traders keep stacking sats like Wall Street bankers stacking fees. Classic.
Technical indicators suggest the rally has legs, though whether it's the start of a new supercycle or just another pump before the dump remains to be seen. One thing's certain: when Bitcoin gets greedy, things get interesting.
Greed Returns To The Market, But Not Yet Overheated
Bitcoin’s price action has spent the majority of the past 48 hours holding above $118,000 after a wave of profit-taking took place just after it peaked at $122,838. However, on-chain data shows an interesting overview of bitcoin investors.
Particularly, crypto analyst Axel Adler Jr. shared data from CryptoQuant showing that the 30-day moving average of the Fear and Greed Index has climbed back into the optimism zone, now sitting at 66.2%. Although sentiment surrounding the leading cryptocurrency is currently in greedy territory, this level is well below the 75% to 80% range, which coincided with new price highs in March 2024 and December 2025
The current 66% reading, while in the green level, suggests there’s still room for bullish sentiment to grow before the market enters a euphoric blow-off phase. In essence, this metric shows that if Bitcoin continues to consolidate and push higher without the sentiment entering into extreme greed levels between 75% and 80%, it will continue on a sustainable push to new heights.
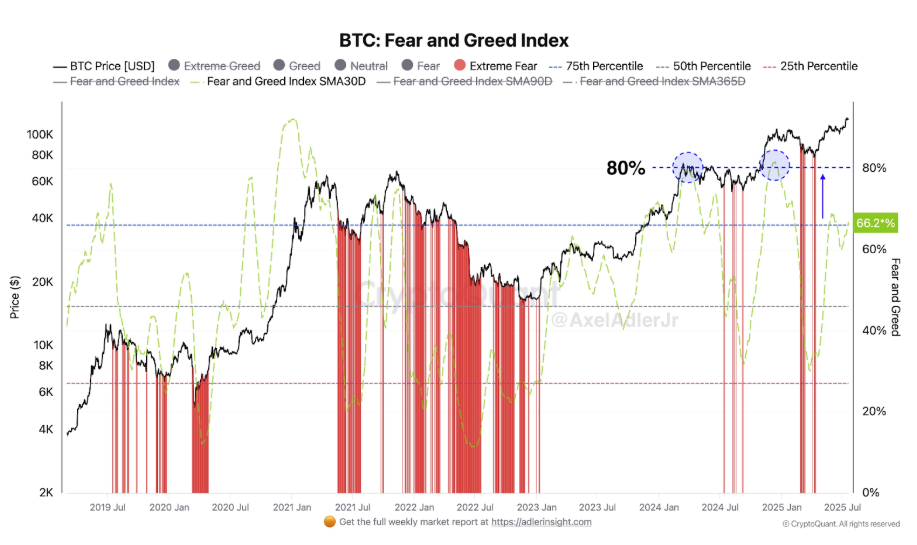
Image From X: @AxelAdlerJr
Bitcoin Re-Enters Resistance Zone On Growth Curve
As mentioned earlier, Bitcoin’s break above the $120,000 price level and its subsequent peak were followed by a wave of profit-taking. The trend saw Bitcoin’s price correct to $116,000 very briefly before stabilizing around $118,000. Interestingly, technical analysis of the weekly candlestick timeframe shows that Bitcoin re-entered the first band of the Logarithmic Growth Curve (LGC) resistance zone as it reached this price peak.
This band, which is identified as the light pink region in the chart below, has always served as the profit-taking area in each of Bitcoin’s past bull markets. Interestingly, Bitcoin briefly tapped this area in December 2024 and January 2025 before being rejected, in a pattern similar to that of January 2021’s first top in the previous bull cycle.
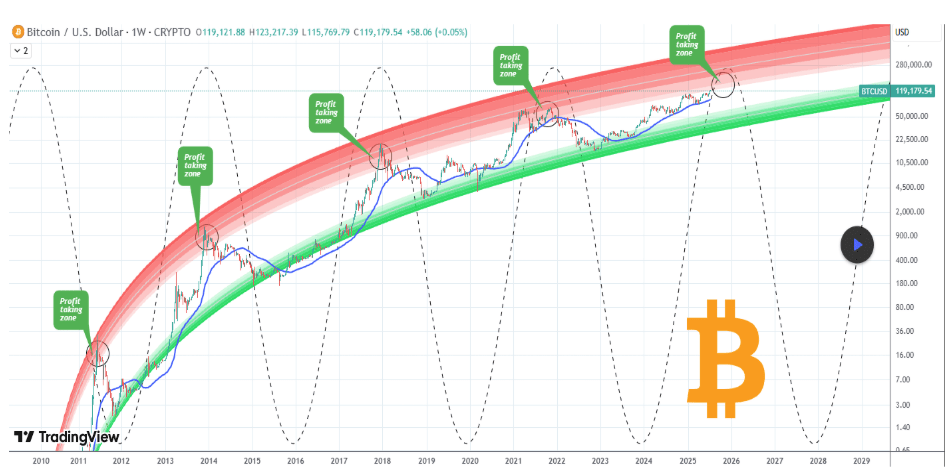
Image From TradingView: TradingShot
Basically, this indicator implies that Bitcoin is now at the start of a final build-up phase. According to crypto analyst TradingShot, who posted the analysis on the TradingView platform, the ultimate top for this cycle is going to be between October and November 2025. Depending on the timing and strength of factors like anticipated US rate cuts in September, Bitcoin’s peak could land anywhere between $140,000 and $200,000.
At the time of writing, Bitcoin is trading at $118,152.
Featured image from Pexels, chart from TradingView
