Bitcoin’s Next Stop? Technical Indicators Signal a Surge Beyond $140,000 — $123,000 Is Just the Beginning

Bitcoin isn't just breaking records—it's rewriting the playbook. Technical analysts now eye a staggering $140,000 target as bullish momentum defies gravity. Forget 'overbought'—this rally laughs at textbook warnings.
The $123,000 'ceiling'? More like a stepping stone. On-chain metrics and whale accumulation patterns suggest institutional FOMO is just getting started. Even traditional finance dinosaurs are quietly reallocating treasury reserves—though they'll never admit it during shareholder calls.
RSI levels that'd trigger panic sells in any other asset class? Bitcoin treats them as a buying opportunity. The only resistance left is psychological—and at this rate, that won't last through Q3.
Of course, Wall Street will claim they saw it coming all along. Just ignore the fact their 2025 price predictions topped out at $80,000... in January.
$140,000 Set As Bitcoin Next Top Target
The Bitcoin price is exhibiting remarkable strength as it continues its parabolic advance beyond the $123,000 range. Technical indicators identified by crypto analyst Mr. Wall Street are now aligning around a new short-term target between $135,000 and $140,000.
According to the market expert’s chart report, BTC has successfully broken out of a Broadening Wedge pattern after consolidating between a descending support and horizontal resistance for nearly two months. The decisive breakout above the $112,000 resistance validates the analyst’s earlier bullish projections.
Initially, the analyst proposed two possible scenarios: A breakout above all-time highs around $112,000 leading directly to a $117,000-$120,000 rally or a brief dip to $92,000 to fill the CME gap before continuing up toward the same target zone.
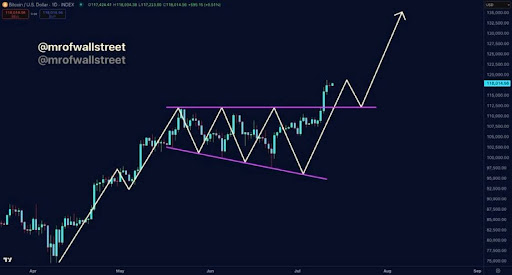
Based on its recent price movement, Bitcoin has chosen to follow the first scenario, underscoring the strength of its bullish momentum and signaling that short-term Fear, Uncertainty, and Doubt (FUD) has had little to no effect. With the second scenario officially invalidated, BTC’s price trajectory is seemingly clearer and higher.
The recent surge above $123,000 has also spotlighted the next major liquidity pool between $135,000 and $140,000. The chart highlights that reaching this zone WOULD liquidate over $45 billion in short positions. Following this, the next target zone sits between $160,000 and $170,000, threatening another $70 billion in short liquidations.
M2 Surge And MACD Fuel BTC’s Bullish Case
Mr. Wall Street’s bullish setup for bitcoin is further supported by macroeconomic and key chart indicators. The analyst pointed to US President Donald Trump’s recent approval of a bill to raise the country’s debt ceiling—a move that signals accelerating debt growth. This, in turn, is expected to expand M2 money supply, which historically correlates with rising prices for assets like Bitcoin.
BTC’s Moving Average Convergence Divergence (MACD) also remains fully intact across all time frames, while the Market Value to Realized Value (MVRV) ratio is still well below historic top levels. In addition, the Relative Strength Index (RSI) has yet to enter overbought territory. These indicators confirm that Bitcoin is still far from a macro top, making the $135,000 – $140,000 range a plausible interim target.
Looking ahead, Mr. Wall Street emphasizes that Bitcoin has entered a supercycle, a phase where the market is marked by price discovery. While he acknowledges the possibility of a short-term retest of the $112,000 level before continuing upward, the analyst maintains that, regardless of minor pullbacks, the price action from here is likely to be swift and aggressive.
