🚀 Ethereum’s Bull Flag Shatters: $3,834 Target Now in Play (Brace for Impact)

Ethereum just ripped through a textbook bull flag—and the charts are screaming upside.
The Setup: After weeks of consolidation, ETH's breakout confirms the pattern's predictive power. No fancy indicators needed—just pure price action doing the talking.
The Target: That $3,834 level isn't arbitrary. It's the measured move projection from the flag's pole height (because Wall Street's Fibonacci obsession finally found something useful).
The Caveat: Liquidity hunters lurk below. A daily close under $3,200 invalidates the setup—but good luck convincing crypto Twitter if that happens. 'Buy the dip' bots are already warmed up.
The Punchline: Whether this pumps or dumps, someone's getting rekt. As always in crypto, the only guaranteed winner is the exchange collecting fees on both sides.
Bull Flag Breakout Points To Measured Move For Ethereum
Ethereum went through an interesting rally last week alongside Bitcoin’s push to new all-time highs. However, this ethereum price rally, which saw it touch $3,000 again, wasn’t based on momentum spillover from Bitcoin alone. This is because Ethereum itself experienced significant institutional interest from Spot Ethereum ETFs.
According to data from SoSoValue, US-based Spot Ethereum ETFs recorded a combined $907.99 million in inflows last week, their best week since the products launched in July 2024. Thursday, July 10, alone was highlighted by inflows of $383.10 million, making it the largest single-day inflow for any Ethereum ETF in 2025 so far.
In a post shared on the social media platform X, crypto analyst Merlijn pointed to a confirmed bull flag breakout on Ethereum’s daily candlestick timeframe chart. Interestingly, the technical setup proposed by the analyst follows a falling wedge reversal that preceded the current uptrend.
According to the chart attached to his analysis, the falling wedge that led to the reversal was formed from the December 2024 highs to the April 2025 lows, with the breakout occurring in mid-May. The breakout eventually saw Ethereum entering into a tight flag-like consolidation that spanned between May and June, until the most recent breakout above $2,700.
That pattern has now resolved to the upside, and the next technical level of interest is a measured MOVE based on the price action that formed the pole of the bull flag. This measured move places the next technical level of price interest at $3,834.
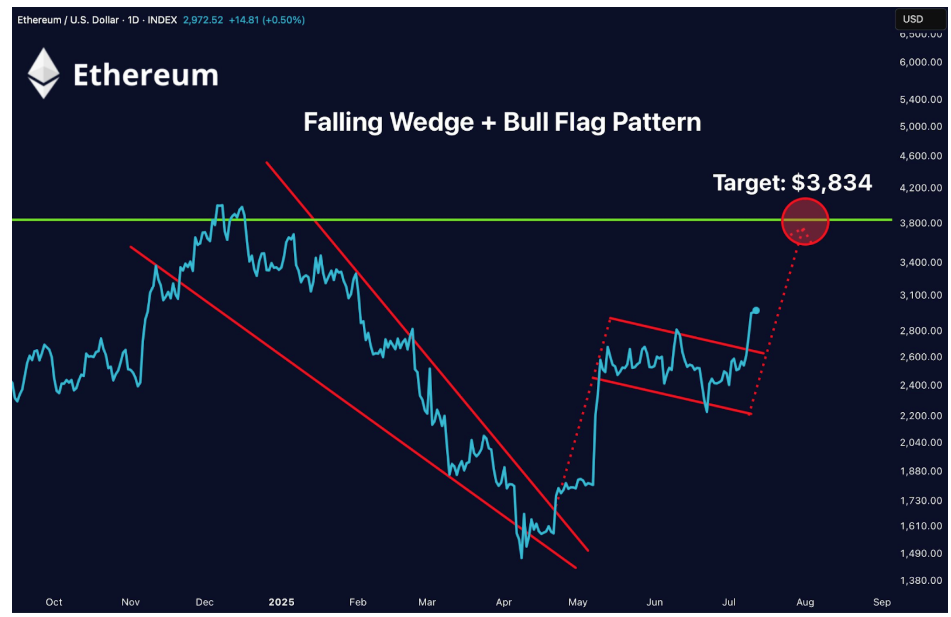
Image From X: Merlijn The Trader
80% Of ETH Now In Profit
On-chain indicators further validate Ethereum’s current strength. According to data from on-chain analytics platform Santiment, Ethereum’s price action has been dancing around the $3,000 mark since Friday, crossing it multiple times intraday. During this back and forth, 124.13 million ETH out of the 155.04 million total supply crossed into profitability, which represents 79.96% of all tokens. This reading is particularly interesting as it is the highest percentage recorded since January 2025.
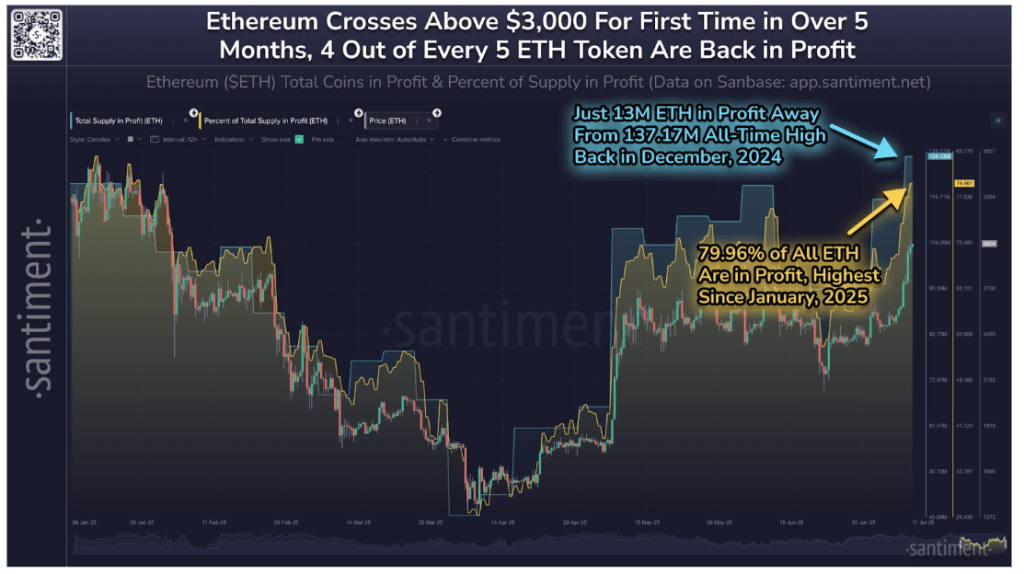
Image From X: Santiment
The same data shows Ethereum is just 13 million coins away from matching the total supply in profit at its previous all-time high of profitability recorded in December 2024. This shift toward a profit-heavy network state tends to encourage holding behavior and long-term conviction, which could translate into reduced sell pressure in the coming week. This, in turn, could see Ethereum close a daily candle above $3,000 and move toward the $3,834 price target during the new week.
At the time of writing, Ethereum is trading at $2,960, up by 17.5% in the past 24 hours.
Featured image from Unsplash, chart from TradingView

Log in to Reply
Log in to comment your thoughtsComments
Related Articles
|Square
Get the BTCC app to start your crypto journey
Get started today Scan to join our 100M+ users