Ethereum Smashes Through $2,800 — Is This the Launchpad for a Historic Bull Run?

Ethereum just bulldozed past a critical resistance level—now the real question is whether bulls can sustain momentum for a parabolic move.
Breaking Barriers: ETH's $2,800 Breakout
The second-largest cryptocurrency didn't just test resistance—it vaporized it. This isn't just technical analysis porn; it's the make-or-break moment for ETH's 2025 narrative.
Bull Case: Liquidity Tsunami Ahead
Market structure suggests institutional players are accumulating at these levels. If the $2,800 support holds, we could see a classic liquidity grab toward $3,400—where, coincidentally, a certain hedge fund manager just opened a new yacht dealership.
Bear Trap Warning
Don't pop the champagne yet. The same on-chain metrics showing accumulation also reveal whale wallets poised to dump at $3,000. This rally will either be the real deal or another 'buy the rumor, sell the news' circus.
The Verdict: Watch the Weekly Close
Price action this week will separate the diamond hands from the leverage junkies. Either way, grab popcorn—ETH's next move could define crypto's summer.
Bulls Eye $4,000 As Long-Term Range Breakout Holds
In an X post on July 12, Daan Crypto explains that $2,800 has acted as a long-standing resistance capping ethereum price action on both sides over the past two years. Following recent bullish fortune, the prominent altcoin decisively broke through this price barrier, signaling intent for further price gains.
However, the price retracement from $3,000 suggests the bulls are facing immediate profit-taking pressure that may force a return below $2,800. According to Daan Crypto, while a quick price dip and buy-back up may not harm current bullish sentiments, a stalled price action under $2,800 may force ETH to revisit lower levels around $2,100-$2,160.
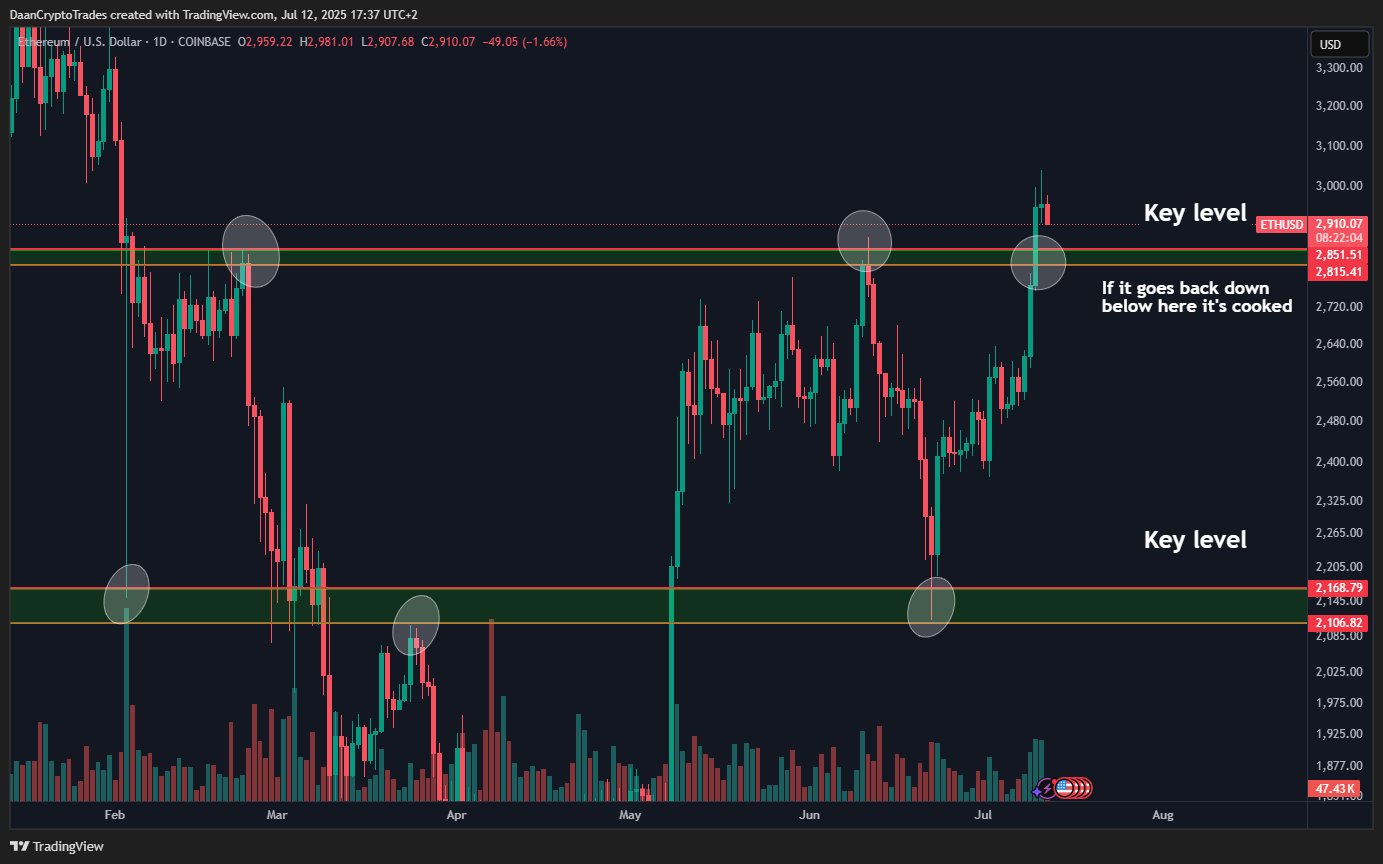
The analyst highlights that ETH bulls maintaining a price point above $2,800 is critical to sustaining the present bullish structure, paving the way for a price return to the market cycle peak at $4,000. From a risk/reward perspective, this level now offers traders a clear invalidation point that market bulls remain in control as long as ETH stays above $2,800.
Interestingly, the Moving Average Convergence Divergence (MACD) indicator on the ETH daily chart backs the potential of a sustained price uptrend. This is because the MACD line recently crossed above the signal line, which is largely interpreted as a bullish signal.
However, it’s worth noting that the Relative Strength Index (RSI) is valued at 71.12, in the overbought zone. This report suggests ethereum holds strong potential of becoming an overheated market, resulting in a wide spread distribution.
Ethereum Market Overview
At the time of writing, Ethereum trades at $2,966 on the daily chart, reflecting a 0.11% decline in the past day. Despite the minor pullback, the asset has posted an impressive 16.53% gain over the past month, indicating that the majority of investors remain in profit.
According to data from blockchain analytics firm Sentora, the Ethereum network recorded total network fees of $6.04 million, representing a modest 0.60% drop compared to the previous week. This slight decline in fees points to a small reduction in transaction activity on the network.
Meanwhile, crypto exchanges registered outflows of $493 million, suggesting investors are opting to keep their assets in private wallets. Such behavior typically reflects growing confidence in the market, as users are less inclined to sell and more likely to hold in anticipation of continued price appreciation.

Log in to Reply
Log in to comment your thoughtsComments
Related Articles
|Square
Get the BTCC app to start your crypto journey
Get started today Scan to join our 100M+ users