🚀 Bitcoin Smashes $118K—Yet Glassnode Flags ’Thin Liquidity’ Risk

Bitcoin's bull run just hit hyperdrive—piercing $118,000 like a hot knife through institutional FUD. But before popping champagne, traders got a reality check from Glassnode's liquidity radar.
Liquidity crunch or paper hands?
On-chain data reveals bid-ask spreads widening faster than a VC's valuation claims. Market depth? Shallow enough to make a meme coin blush. This ain't your 2021 liquidity pool—whales are playing chicken with order books.
Wall Street's watching (and sweating)
Traditional finance still can't decide if this is a 'digital gold' breakout or a leverage-fueled mirage. Meanwhile, crypto OGs shrug—thin liquidity just means volatile pumps work both ways. Just ask the hedge funds still nursing 2022's graves.
One thing's clear: when the 'number go up' machine starts coughing, even diamond hands check their exits. Tick-tock, Wall Street.
Bitcoin Volume Still At Historically Low Levels
Just recently, Glassnode had revealed that volume related to Bitcoin had dropped to yearly lows, potentially hinting at the start of a summer lull. Now, following the breakout to new highs, the on-chain analytics firm has shared updated data in a reply to an X user, showcasing how volume has changed since.
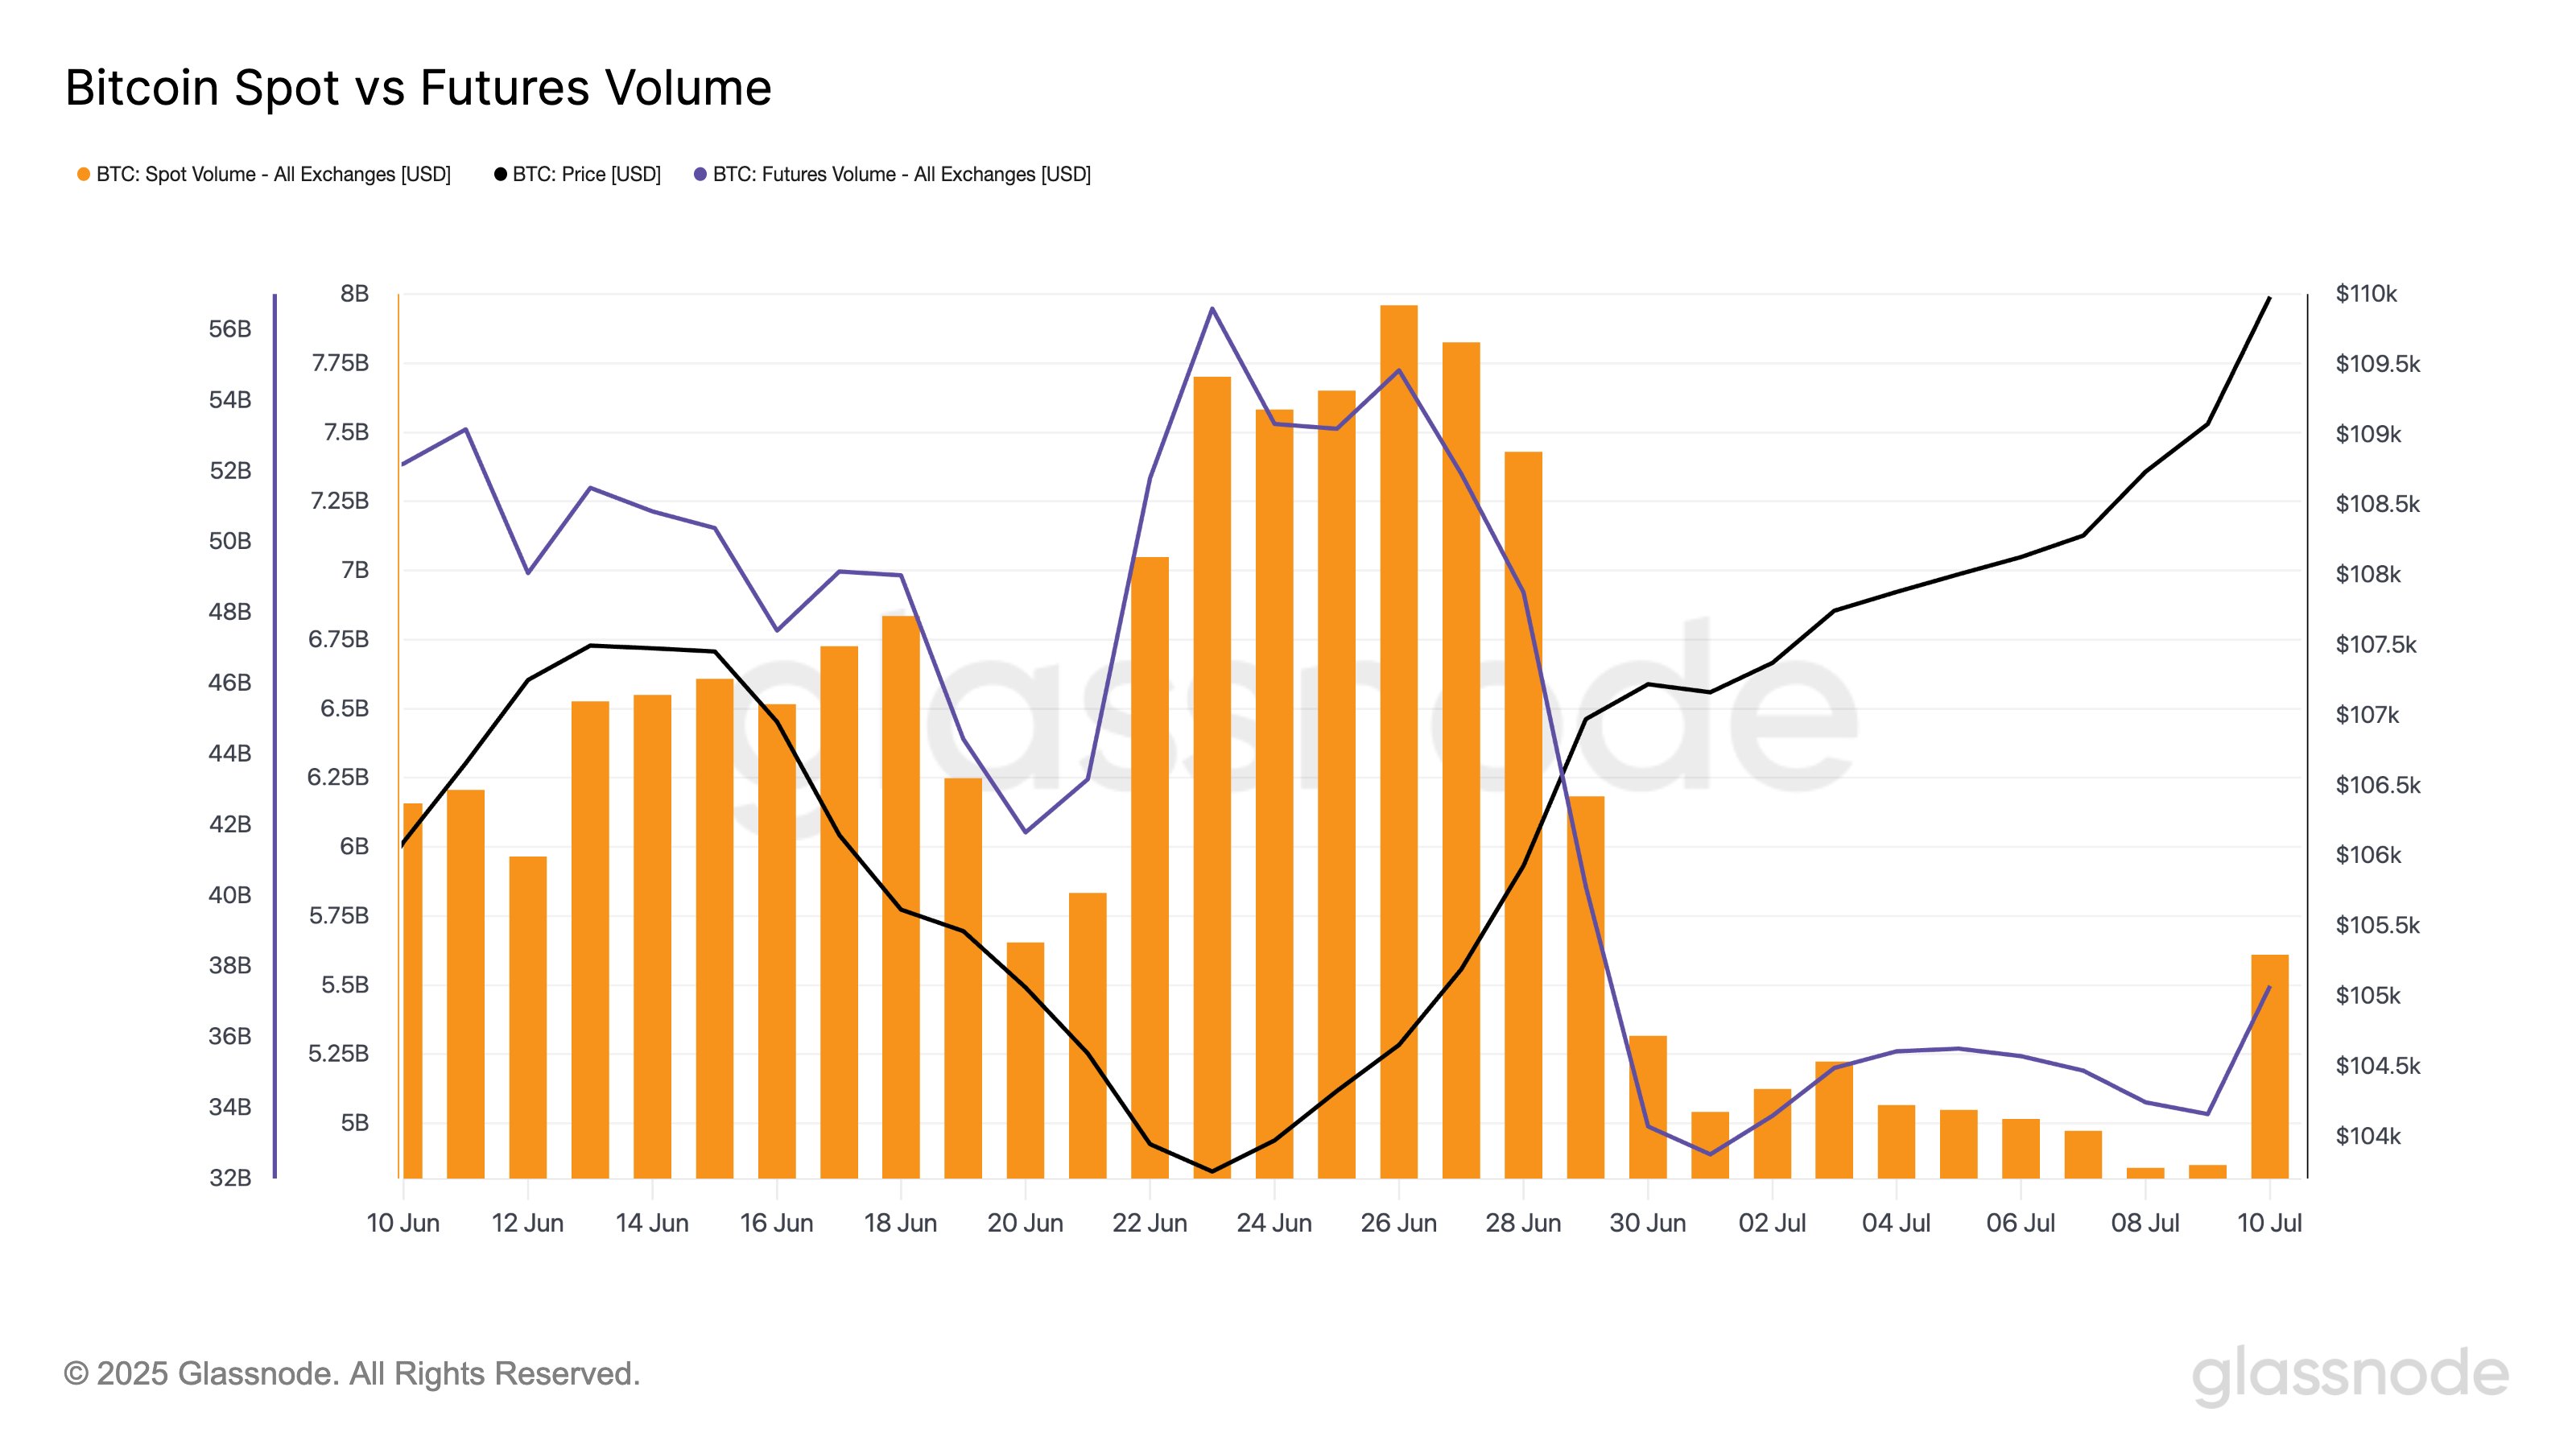
From the chart, it’s visible that both the Spot and Futures Volumes, corresponding to bitcoin trading activity occurring on the spot and futures platforms, respectively, plummeted at the end of June and remained low into early July.
With the latest price breakout, however, both metrics have seen an increase, suggesting activity has noted an uplift across both the spot and futures markets. That said, while there has indeed been an uptick in trading, volumes still remain low when compared to history.
Historically, rallies have usually only been sustainable when they have been able to capture mass attention from the traders. This is because the fresh activity is what ends up providing fuel for these runs to keep going.
“The takeaway here is that BTC hit an ATH despite thin liquidity – worth paying attention to,” notes the analytics firm. It now remains to be seen whether the activity increase WOULD continue in the coming days or if the lull is here to stay.
In some other news, a key Bitcoin indicator still remains outside the euphoria zone, as Glassnode has pointed out in another X post. The metric in question is the Net Unrealized Profit/Loss (NUPL) of the long-term holders.
The NUPL measures, as its name suggests, the net amount of unrealized profit or loss that the BTC investors are currently holding. Here, the NUPL of the long-term holders (LTHs) specifically is of interest, who are the investors holding their coins for more than 155 days.
Below is a chart that shows the trend in the Bitcoin LTH NUPL over the past year.
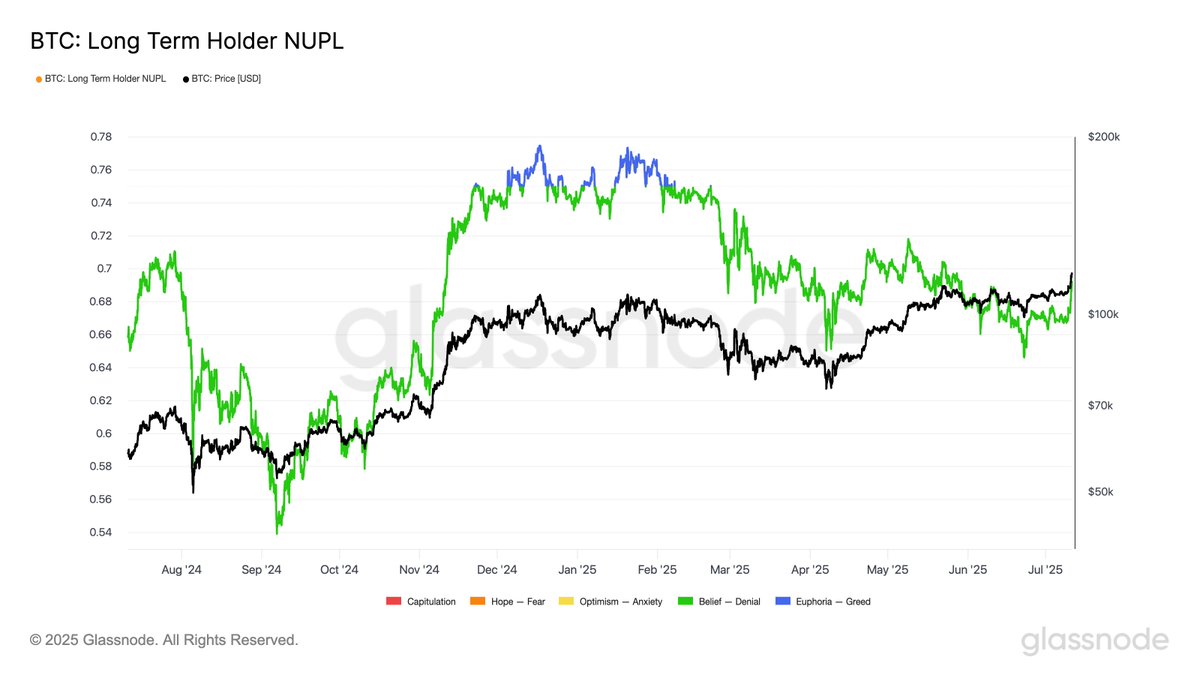
As displayed in the graph, the Bitcoin LTH NUPL has observed a rise alongside the latest price rally as LTH profits have grown. However, despite this, the indicator stands at 0.69, which is under the 0.75 level that has historically separated euphoric markets.
“This cycle has seen just ~30 days above the 0.75 threshold, compared to 228 days in the previous cycle,” says the analytics firm. The metric was last above this level in February.
BTC Price
At the time of writing, Bitcoin is floating around $118,000, up over 9% in the last week.
