Bitcoin Shatters All-Time High — Bulls Charge Into Uncharted Territory

Digital gold just got a whole lot shinier. Bitcoin blasted past its previous peak today, leaving skeptics scrambling and hodlers popping champagne.
The rally defies traditional market logic—again—proving crypto marches to its own beat. Wall Street analysts now face the awkward task of explaining why their "bubble" calls keep bursting.
This isn't just a number—it's a middle finger to fractional reserve banking. The decentralized revolution keeps gaining ground while central banks inflate currencies into oblivion.
Will the momentum hold? Who cares—today belongs to the diamond hands. Just remember: every banker calling this a ponzi probably bought the dip.
Bitcoin Price Sets New ATH
Bitcoin price started a fresh increase after it cleared the $110,500 resistance zone. BTC gained pace for a MOVE above the $112,000 and $113,500 resistance.
Besides, there was a break above a bearish trend line with resistance at $111,000 on the hourly chart of the BTC/USD pair. The bulls even pumped the pair above the $115,000 resistance zone. A new all-time high was formed at $116,800 and the price is now consolidating gains above the 23.6% Fib retracement level of the upward move from the $110,600 swing low to the $116,800 high.
Bitcoin is now trading above $113,500 and the 100 hourly Simple moving average. Immediate resistance on the upside is NEAR the $116,000 level. The first key resistance is near the $116,200 level. The next resistance could be $116,800.
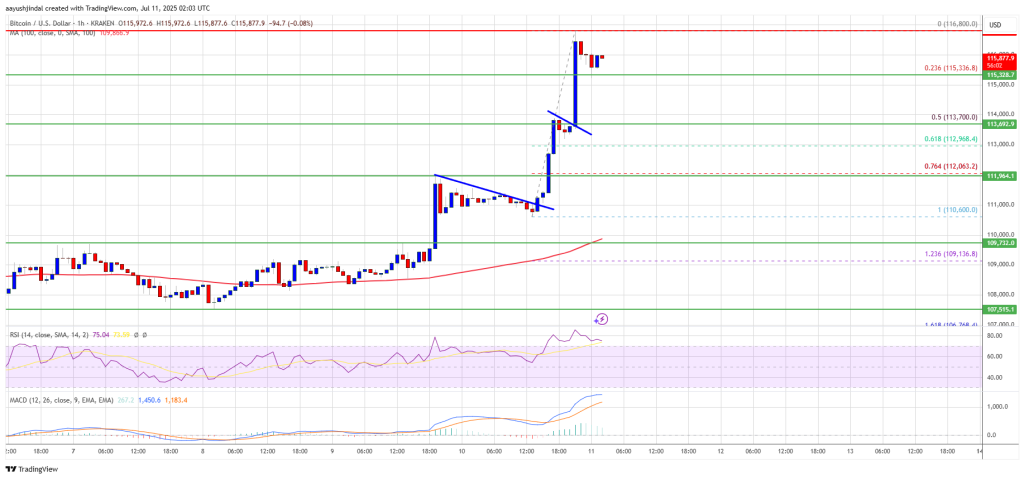
A close above the $116,800 resistance might send the price further higher. In the stated case, the price could rise and test the $118,000 resistance level. Any more gains might send the price toward the $118,800 level. The main target could be $120,000.
Downside Correction In BTC?
If Bitcoin fails to rise above the $116,800 resistance zone, it could start a downside correction. Immediate support is near the $115,300 level. The first major support is near the $113,700 level or the 50% Fib retracement level of the upward move from the $110,600 swing low to the $116,800 high.
The next support is now near the $113,200 zone. Any more losses might send the price toward the $112,500 support in the near term. The main support sits at $110,500, below which BTC might continue to move down.
Technical indicators:
Hourly MACD – The MACD is now gaining pace in the bullish zone.
Hourly RSI (Relative Strength Index) – The RSI for BTC/USD is now above the 50 level.
Major Support Levels – $115,300, followed by $113,700.
Major Resistance Levels – $116,800 and $118,000.

Log in to Reply
Log in to comment your thoughtsComments
Related Articles
|Square
Get the BTCC app to start your crypto journey
Get started today Scan to join our 100M+ users