XRP Just Triggered a Rare Signal That Sparked a 464% Surge Last Time – History Repeating?

XRP is flashing a technical pattern that previously rocketed its price by 464%—and crypto analysts are buzzing.
The Ghost of Rallies Past
Same setup. Same asset. Same traders scrambling to check their 2017 notes. The last time this signal appeared, XRP morphed from courtroom drama to market darling in weeks.
The Cynic’s Corner
Of course, Wall Street would charge you 2% management fees to replicate this ‘strategy’—just buy when the lines cross and pray the SEC doesn’t tweet. Crypto’s efficiency at its finest.
The Bottom Line
Whether this plays out like 2017 or becomes another ‘almost’ moment depends on one thing: if traders still believe in technicals after getting rug-pulled by ‘institutional adoption’ narratives for half a decade.
XRP Breakout Confirmed?
Yesterday, XRP recorded its highest 4-hour close since May 23, breaking out of a prolonged range. The token has entered what he called a “dense area of liquidity,” an important technical zone that has historically preceded impulsive price action. In a notable divergence from typical market dynamics, XRP is leading Bitcoin, rather than following it. “XRP is currently leading Bitcoin on this move,” he said. “Something I’ve been calling for a while is for XRP to lead alts and lead a potential alt season.”
CryptoInsightUK sees further confirmation in Bitcoin’s setup. BTC is still consolidating but pushing above the $111,000 liquidity zone. A move into that zone, he said, WOULD “give us confluence that the price action XRP’s displaying is not a fakeout.”
Structurally, XRP’s trend remains intact. Despite recent pullbacks, the token has maintained its higher-low formation, a signal of technical strength. More importantly, XRP/BTC is beginning to show momentum reversal. “We’ve just had the highest 4-hour close since the 24th of May. This is showing the momentum to the downside is waning.”
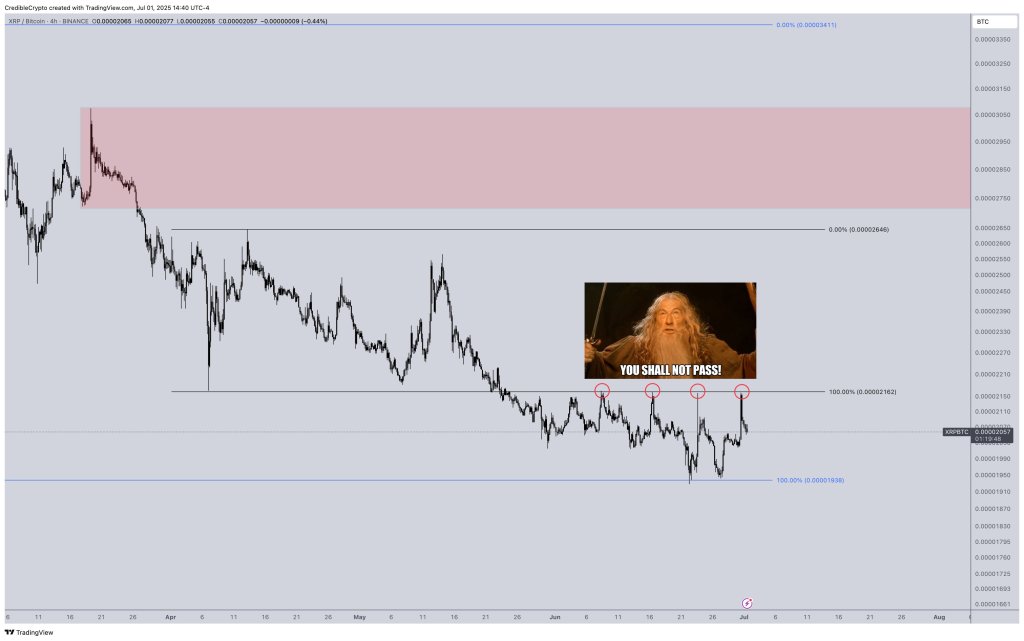
He highlights a specific line on the XRP/BTC chart referenced by fellow analyst Credible Crypto as the “Gandalf line”—a level that has acted as a pivot point for years. XRP has now closed above it on the 4-hour chart. “We’ve wicked into it, bounced off it. We lose it, we get pushed down hard. We break it, we normally really go for it.”
Zooming out, he points to the weekly RSI (Relative Strength Index) on XRP’s price chart. If the current weekly candle closes above the RSI’s simple moving average, it would be the first time since XRP’s breakout off the lows—an event that previously triggered a 464% MOVE to $2.70. “If we get the bullish cross close… 464% from this [level] would take us to $13.05,” he explained. “I think we’re going to about $12 on this push.”
Moreover, the analyst anticipates a 325% move in XRP/BTC based on historical ratios and a potential surge in XRP dominance toward 14%, with an even more aggressive Elliott Wave count pointing to a possible move to 20% dominance. “We’ve completed a Wyckoff accumulation. We’re in the sign of strength phase. Last point support… we’re going into phase E,” he said, referencing classical technical accumulation structures.
Still, despite the bullish setup, the analyst made clear he plans to de-risk between $8 and $13, emphasizing capital preservation after a potential 20x move from 50 cents. “The risk-to-reward on the downside is just too large at that point,” he noted. “Even if it goes significantly higher… anyone who’s done a 20x on something should be taking some money off the table.”
He concluded the analysis with cautious optimism: “Don’t start counting your Lambos yet, but also probably start scrolling the magazine.” For now, all eyes are on XRP’s price action and Bitcoin’s staying power above $111,000. If both confirm, as he put it: “It’s game on.”
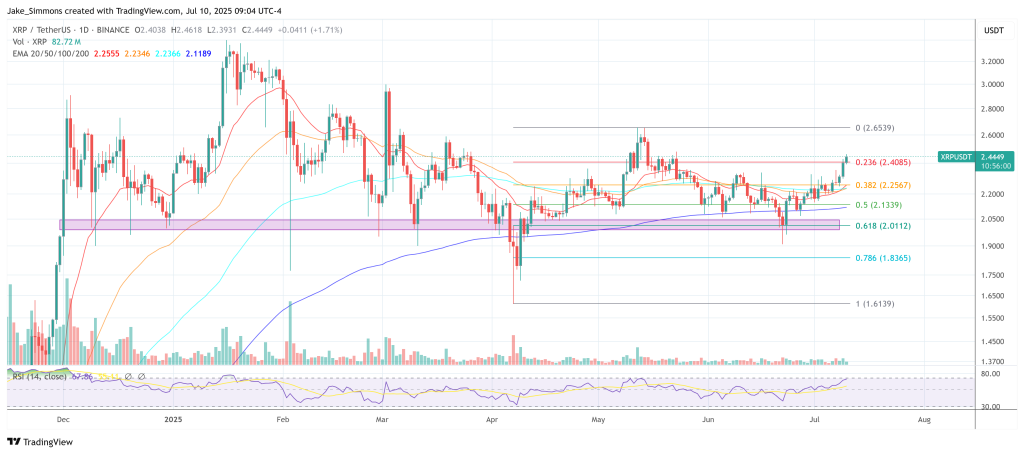
At press time, XRP traded at $2.44.

Log in to Reply
Log in to comment your thoughtsComments
Related Articles
|Square
Get the BTCC app to start your crypto journey
Get started today Scan to join our 100M+ users