Bitcoin Holds Firm at Critical Support — Bulls Gearing Up for Next Leg Up

Bitcoin's price action just flashed a bullish signal that traders can't ignore.
The king of crypto found solid footing at a key support zone—now the market's waiting to see if this is the launchpad for the next rally.
Technical Backstop Holds Strong
After weeks of sideways action, BTC decisively rejected lower prices at a level that's historically marked turning points. Chart analysts are dusting off their moon math as accumulation patterns mirror previous breakout setups.
Liquidity Hunt in Progress
Whales appear to be positioning for upside, with derivatives data showing aggressive call option buying. Spot markets remain oddly calm—either a coiled spring or another 'buy the rumor, sell the news' trap waiting to snap shut.
If this support holds through the week, we could see a replay of 2024's explosive Q3 moves. Or, in traditional finance terms: another volatile casino ride that makes goldbugs clutch their pearls.
Bitcoin Price Eyes Upside Break
Bitcoin price started a fresh decline after it failed NEAR the $110,000 zone. BTC declined below the $108,500 and $108,000 levels before the bulls appeared.
A low was formed at $107,650 and the price started a recovery wave. There was a move above the $108,500 resistance zone. The price climbed above the 50% Fib retracement level of the downward move from the $109,700 swing high to the $107,500 low.
Bitcoin is now trading above $108,500 and the 100 hourly Simple moving average. The first key resistance is near the $109,050 level. Besides, there is a bearish trend line forming with resistance at $109,050 on the hourly chart of the BTC/USD pair.
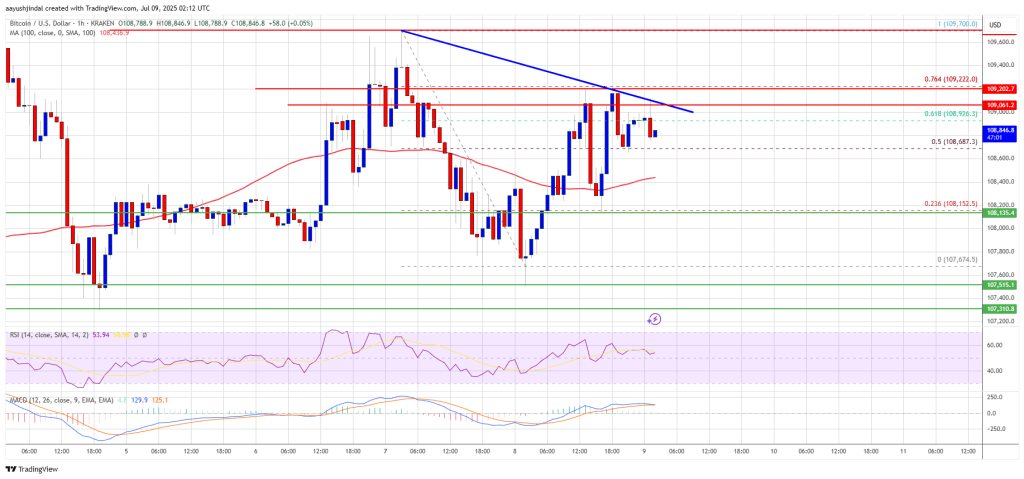
The next resistance could be $109,200 or the 76.4% Fib level of the downward move from the $109,700 swing high to the $107,500 low. A close above the $109,200 resistance might send the price further higher. In the stated case, the price could rise and test the $110,000 resistance level. Any more gains might send the price toward the $112,000 level. The main target could be $115,000.
Another Decline In BTC?
If Bitcoin fails to rise above the $109,200 resistance zone, it could start another decline. Immediate support is near the $108,400 level. The first major support is near the $108,200 level.
The next support is now near the $107,500 zone. Any more losses might send the price toward the $105,500 support in the near term. The main support sits at $103,500, below which BTC might continue to move down.
Technical indicators:
Hourly MACD – The MACD is now gaining pace in the bullish zone.
Hourly RSI (Relative Strength Index) – The RSI for BTC/USD is now above the 50 level.
Major Support Levels – $108,500, followed by $107,500.
Major Resistance Levels – $109,200 and $110,000.
