Altcoins Smash Through Historic Trendline – Is Another 2021-Style Mega Rally Imminent?

Altcoins are back on the offensive, retaking a critical trendline that preceded their last parabolic surge. The charts are flashing a familiar signal—but this time, the stakes are higher.
The Ghost of Bull Runs Past
Remember 2021? When ETH, SOL, and a parade of altcoins turned modest portfolios into generational wealth? That same technical formation just reappeared on weekly charts. Traders are sweating over their keyboards.
Liquidity Tsunami Ahead?
Market depth looks thinner than a crypto influencer's trading expertise. If bids stack up behind this breakout, we could see alt season 3.0—complete with the usual circus of shitcoin pumps and 'degen' Twitter meltdowns.
The Institutional Wildcard
BlackRock wasn't buying Dogecoin derivatives in 2021. Now? Wall Street's playing with crypto legos while retail tries not to get rekt. The trendline might hold—but this ain't your older brother's altcoin market anymore.
History doesn't repeat, but it often rhymes. Whether that rhyme spells 'moon' or 'doom' depends on who's left holding the bags when the music stops.
Altcoins Eye Vertical Move As Bear Trap Ends
The altcoin market may be on the brink of a historic breakout, according to a recent chart analysis by crypto expert Merlijn The Trader. The analyst draws parallels between the current cycle and those of 2017 and 2021. The analyst’s chart, published on X social media, shows that the total altcoin market capitalization has reclaimed a long-term ascending trendline that had preceded previous vertical expansions during major bull runs.
In earlier cycles, altcoins briefly broke this trendline in what was identified as a “bear trap” before swiftly reversing and launching into explosive growth phases. Merlijin The Trader reveals that this pattern appears to be repeating in this cycle, as the current market structure mirrors previous setups that triggered rapid valuation increases across the altcoin sector.
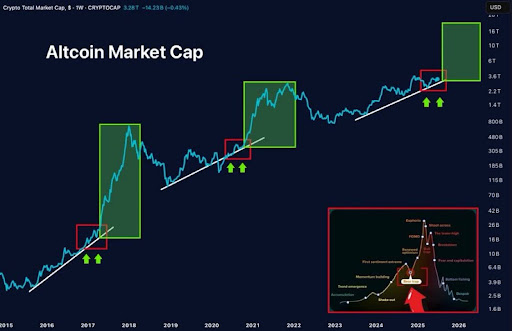
The ascending trendline recovery is framed within a red box in the chart, consistent with the zones that marked the end of prior downtrends. In each instance, the reclaim was followed by aggressive upward movement, highlighted by green boxes that represented parabolic gains in the total market cap.
Merlijn The Trader suggests that the recent rebound indicates the completion of another bear trap, signaling renewed bullish momentum. Green arrows placed below the price curve, matching the timing of previous breakouts within the analyst’s chart, imply that the altcoin market could be preparing for another phase of expansion. If the historical fractal holds, the analyst forecasts a sharp vertical rally for altcoins, with valuations possibly reaching the $10-$16 trillion range.
Altcoin Market Mirror 2016-2018 Breakout Setup
In another fresh analysis, Merlijn The Trader noted that the altcoin market cap is showing signs of repeating a historical pattern that previously led to a major bull rally. A comparison between the 2016-2018 market cycle and the current one reveals an almost identical structure playing out, albeit on a much larger scale.
The market appears to have formed a Double Bottom, followed by a mid-cycle correction and consolidation within a descending broadening wedge pattern. This same fractal unfolded before the explosive altcoin rally in 2017. The analyst’s chart also illustrates that in the previous cycle, altcoins broke out of this same wedge pattern, resulting in a massive surge in market capitalization, which he referred to as “Pump 2.0”.
With the same breakout now confirmed for this cycle’s market structure, Merlijn The Trader predicts that the altcoin sector may be entering its next parabolic expansion phase. This development could mark the end of the altcoin market’s current bear phase and the beginning of a second macro pump similar to what occurred between 2017 and early 2018.

Log in to Reply
Log in to comment your thoughtsComments
Related Articles
|Square
Get the BTCC app to start your crypto journey
Get started today Scan to join our 100M+ users