Bitcoin Roars Back: Is a Historic Breakout Imminent in July 2025?

BTC bulls are back in charge—but can they smash through resistance and claim new all-time highs?
The Setup: After weeks of sideways action, Bitcoin's chart is printing green candles again. Liquidity pools are priming, derivatives traders are flipping long, and that old Wall Street mantra about 'Sell in May' just got trampled by a digital bull.
Key Levels to Watch: The $70K psychological barrier remains the line in the sand. Break it, and we're in price discovery mode. Fail, and prepare for another round of 'macro headwinds' excuses from the same analysts who missed the 2024 rally.
Wildcard: Spot ETF flows show institutions are quietly accumulating. Meanwhile, crypto Twitter's permabears are suddenly remembering their 'long-term HODL' strategies.
Bottom Line: This isn't your 2021 meme-coins-and-leverage frenzy. Bitcoin's marching to institutional adoption—whether traditional finance is ready or not.
Bitcoin Price Eyes More Gains
Bitcoin price started a fresh increase after it settled above the $107,500 resistance. BTC cleared many hurdles NEAR $108,000 to start a decent increase.
The bulls pushed the price in a positive zone above the $108,500 level. The price gained pace for a MOVE above the 50% Fib retracement level of the downward move from the $110,515 swing high to the $107,299 low. Besides, there was a break above a key bearish trend line with resistance at $109,350 on the hourly chart of the BTC/USD pair.
Bitcoin is now trading above $108,500 and the 100 hourly Simple moving average. On the upside, immediate resistance is near the $109,750 level. It is close to the 76.4% Fib retracement level of the downward move from the $110,515 swing high to the $107,299 low.
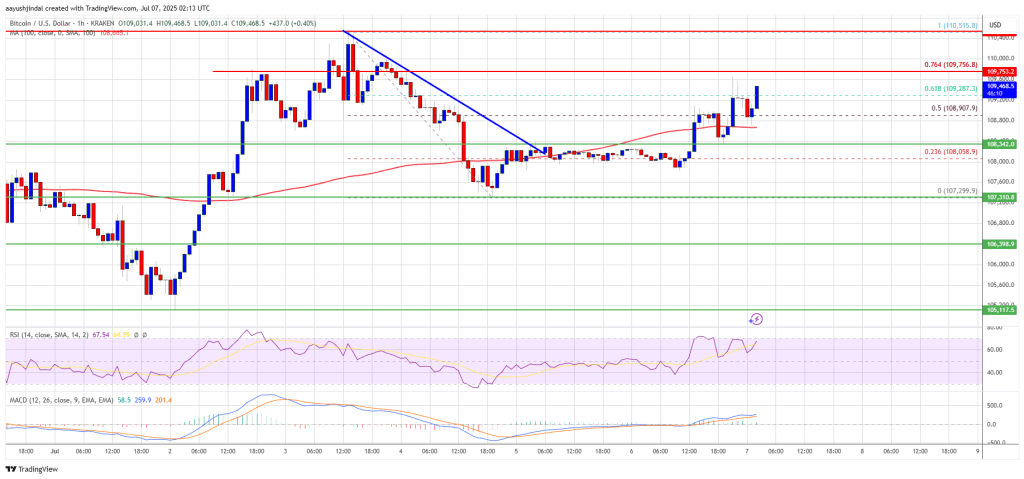
The first key resistance is near the $110,000 level. A close above the $110,000 resistance might send the price further higher. In the stated case, the price could rise and test the $112,000 resistance level. Any more gains might send the price toward the $113,200 level. The main target could be $115,000.
Downside Correction In BTC?
If Bitcoin fails to rise above the $110,000 resistance zone, it could start another decline. Immediate support is near the $108,800 level. The first major support is near the $108,350 level.
The next support is now near the $107,250 zone. Any more losses might send the price toward the $106,400 support in the near term. The main support sits at $105,000, below which BTC might continue to move down.
Technical indicators:
Hourly MACD – The MACD is now gaining pace in the bullish zone.
Hourly RSI (Relative Strength Index) – The RSI for BTC/USD is now above the 50 level.
Major Support Levels – $108,800, followed by $108,350.
Major Resistance Levels – $110,000 and $110,500.

Log in to Reply
Log in to comment your thoughtsComments
Related Articles
|Square
Get the BTCC app to start your crypto journey
Get started today Scan to join our 100M+ users