Solana Teeters on Rising Channel Edge – A Breakdown Here May Trigger $128.50 Plunge

Solana's price action hangs by a thread as it tests critical rising channel support. Fail here, and traders could see a swift descent toward $128.50—a level that might shake out weak hands.
Technical tension mounts
The SOL chart paints a precarious picture: every bounce along this trendline has been weaker than the last. Market makers seem to be playing chicken with retail—who'll blink first?
Liquidity hunt underway
That $128.50 target isn't arbitrary. It's where a swarm of stop losses likely lurks—perfect bait for algorithmic traders who feast on overleveraged degens. (Ah, the beautiful efficiency of crypto markets—where your portfolio becomes someone else's lunch.)
Make-or-break moment
Watch the volume on any breakdown. Thin order books could accelerate the drop, while sustained buying might spark a short squeeze. Either way—buckle up.
Solana Holds Key Support Amid Rising Channel Formation
Solana is currently trading below the $150 level, reflecting a notable 20% decline from its local high set in May. Despite this setback, the asset continues to hold a strong support base, signaling that bullish sentiment has not entirely faded. The broader market remains in a consolidation phase, with Solana showing signs of indecision as it moves sideways within a tightening price range.
Analysts remain cautiously optimistic, pointing out that a breakout above the key $150–$160 supply zone could spark renewed upside momentum. However, the current price structure suggests that Solana may not be ready yet to retest previous highs. According to Carl Runefelt, Solana is ranging within a rising channel—a pattern that can lead to sharp movements if broken.
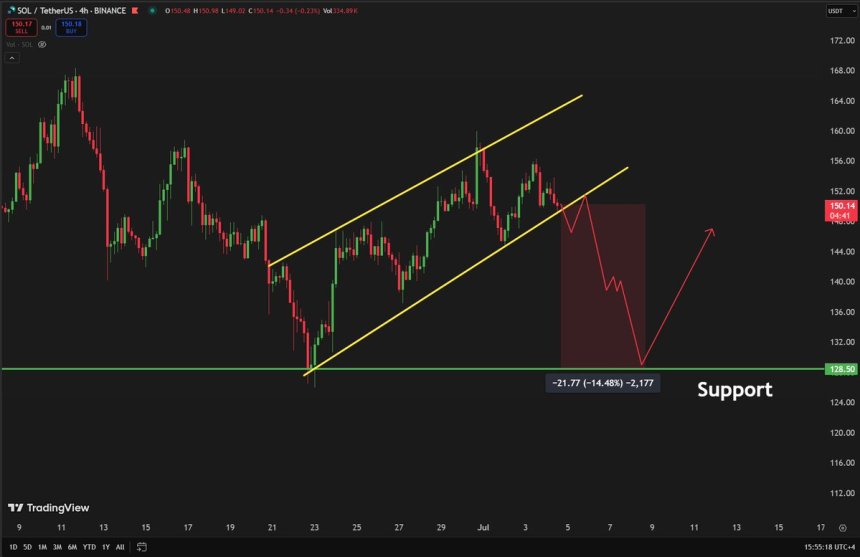
While rising channels can sustain bullish continuation, a breakdown below the lower trendline often results in accelerated downside moves. Runefelt warns that if Solana breaks below the channel, the next key support area lies around $128.50. This level has historically acted as a strong demand zone and could serve as the next target in the event of a bearish move.
In the meantime, Solana’s consolidation reflects broader market uncertainty, with traders waiting for a decisive breakout or breakdown to guide positioning. A successful reclaim of the $150 level WOULD improve sentiment significantly and could set the stage for a push toward the $170–$180 range. On the other hand, failure to hold above current levels may shift the narrative toward further downside risk.
SOL Holds Range Amid Resistance
Solana (SOL) is currently trading at $147.62, moving sideways within a tightening range and forming a potential rising channel pattern. The daily chart reveals that SOL has been unable to break decisively above the $155–$160 resistance zone, while strong support remains NEAR the $140 level. Price action shows repeated rejections near the 100-day moving average (blue line), which now acts as dynamic resistance around $155.60. The 200-day moving average (red) sits further above $165.54, marking a long-term resistance area.
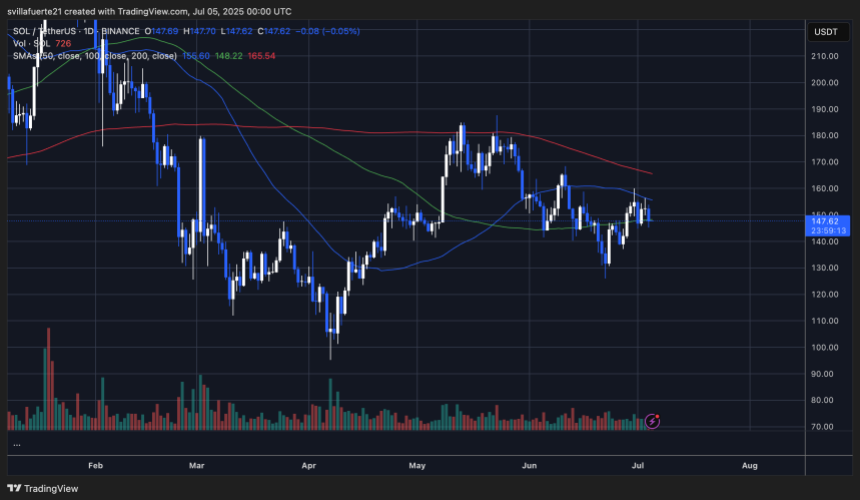
Volume remains relatively low compared to early June spikes, suggesting market participants are waiting for a clear breakout direction. A push above $160 would likely trigger bullish momentum, potentially opening the door toward the $170 level. However, the rising channel identified by analysts suggests a possible downside risk if the lower trendline fails.
If Solana breaks below the $145 support and falls out of the channel, the next target would be the $128.50 area, which previously acted as a demand zone in mid-May. Until then, bulls must defend current levels and aim to reclaim the 100-day SMA to maintain the broader recovery structure. The coming sessions may offer clarity as consolidation nears its resolution.
Featured image from Dall-E, chart from TradingView
