XRP Primed for a Comeback: Key Support Levels to Watch in July 2025

XRP teeters on the edge of a bullish reversal—traders are eyeing critical support levels like hawks.
Will the embattled crypto defy the bears or get dragged deeper into the trenches? Here's what the charts suggest.
Support or surrender? The $0.50 zone emerges as a make-or-break battleground for XRP bulls. A bounce here could trigger a 20% rally, while a breakdown might send bagholders into yet another 'long-term investment' narrative.
Meanwhile, Bitcoin's sideways action leaves altcoins to fight for scraps—because nothing says 'financial revolution' like watching your portfolio oscillate between despair and cautious optimism.
XRP Price Faces Resistance
XRP price started a fresh increase after it settled above the $2.20 level, like Bitcoin and Ethereum. The price was able to climb above the $2.220 resistance level.
The bulls were able to push the price above the $2.250 level. However, the bears were active near the $2.320 level. A high was formed at $2.310 and the price is now correcting some gains. There was a MOVE below the 23.6% Fib retracement level of the upward move from the $2.148 swing low to the $2.310 high.
The price is now trading above $2.220 and the 100-hourly Simple Moving Average. Besides, there is a key bullish trend line forming with support at $2.2250 on the hourly chart of the XRP/USD pair.
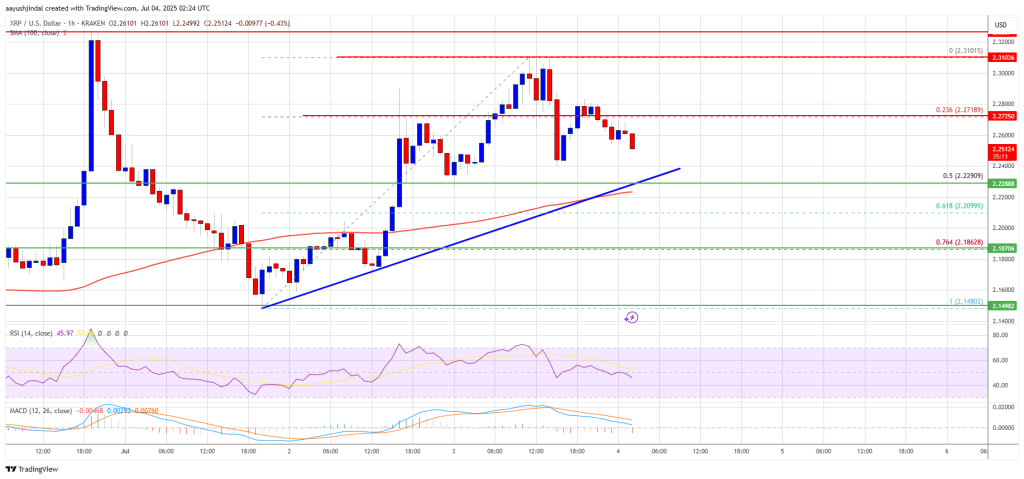
On the upside, the price might face resistance near the $2.2720 level. The first major resistance is near the $2.30 level. The next resistance is $2.320. A clear move above the $2.320 resistance might send the price toward the $2.350 resistance. Any more gains might send the price toward the $2.40 resistance or even $2.420 in the near term. The next major hurdle for the bulls might be $2.50.
More Losses?
If XRP fails to clear the $2.30 resistance zone, it could start another decline. Initial support on the downside is near the $2.2250 level and the trend line. The next major support is near the $2.20 level or the 61.8% Fib retracement level of the upward move from the $2.148 swing low to the $2.310 high.
If there is a downside break and a close below the $2.20 level, the price might continue to decline toward the $2.150 support. The next major support sits near the $2.120 zone.
Technical Indicators
Hourly MACD – The MACD for XRP/USD is now gaining pace in the bearish zone.
Hourly RSI (Relative Strength Index) – The RSI for XRP/USD is now below the 50 level.
Major Support Levels – $2.2250 and $2.20.
Major Resistance Levels – $2.30 and $2.320.
