Bitcoin’s TD9 Setup Hints at $149K Target Within 4 Years — Here’s Why Traders Are Buzzing

Bitcoin's chart just flashed a TD9 signal—and history suggests a wild ride ahead. Could $149,000 be in play by 2029? Buckle up.
The Pattern That Has Bulls Salivating
The TD Sequential indicator triggered its ninth consecutive bullish candle, a rare setup that previously preceded massive BTC rallies. Same pattern, same stakes.
Four Years to Glory (Or Pain)
If the fractal holds, we're looking at a 2029 timeline for that six-figure price tag. Perfect for impatient traders who think 'long-term' means waiting through a lunch break.
Why This Time Might Actually Be Different
Institutional adoption meets shrinking supply—basic economics, if you ignore the occasional 40% 'discount' along the way. Just hedge fund things.
One thing's certain: Bitcoin never takes the escalator when it can ride the fireworks. Whether you're stacking sats or shorting the top, keep your seatbelt fastened.
TD9 Setup Hints At Slow Climb To $149,000
The TD9 is a component of the TD Sequential indicator, which is often used to identify trend exhaustion, potential reversals, and possible trend changes. Interestingly, what makes this particular signal notable at this point is that it is now projecting a TD Risk level of $149,490, which is essentially a price target for Bitcoin. But if past patterns on the TD9 indicator are anything to go by, getting there might take much longer than bulls expect.
In 2017, a similar perfected TD9 appeared during Bitcoin’s first rally to $20,000. At the time, the TD Risk was projected at $35,000. It wasn’t until late 2020, roughly four years later, that Bitcoin finally reached and broke above that level. A prior occurrence in 2014 offered the same story.
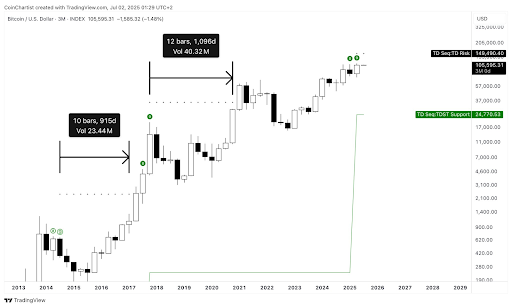
Back then in 2014, the TD9 setup projected a TD Risk of $2,400, but it took approximately 3.5 years to cross that threshold. Now, despite the bullish sentiment today, this historical precedent suggests it could take similar years before the $149,490 target being currently projected by the TD Risk is finally tested or breached.
The 3-month candlestick price chart shown above provides a visual analysis of this projection. From the 2014 cycle low, it took 915 days across 10 quarterly candles for Bitcoin to reach its next high. After the 2017 signal, it took 1,096 days (or 12 quarterly candlesticks) for BTC to finally surpass the projected TD Risk level.
Bitcoin Price Action On Gradual Climb
Bitcoin has spent the past seven days in a steady but modest uptrend, rising approximately 1.5% from a weekly low around $105,430 to the current range between $109,240 and $109,600. During this move, Bitcoin’s price action tested and retested resistance in the $108,200 to $108,800 zone several times in the past 24 hours. However, it ultimately pushed higher, showing a slow but stable bullish undertone.
At the time of writing, Bitcoin is trading at $109,330, up by 2% in the past 24 hours. It is currently about a 36% MOVE away from reaching the $149,490 price target. However, if Tony Severino’s timeline on the TD9 Risk setup does play out, it wouldn’t be until sometime around July 2029 before Bitcoin reaches the $149,490 price target.

Log in to Reply
Log in to comment your thoughtsComments
Related Articles
|Square
Get the BTCC app to start your crypto journey
Get started today Scan to join our 100M+ users