Bitcoin’s 2-Year Sideways Grind? Top Analyst Insists Bull Cycle Still Has Legs

Bitcoin's price chart looks like a flatlining EKG—but one prominent analyst claims the crypto king's heartbeat is stronger than ever.
The sideways conspiracy
Twenty-four months of chop. No new all-time highs since 2023. Retail traders jumping ship to meme stocks and AI tokens. Yet the Bitcoin faithful keep HODLing through the boredom.
Cycle math vs. market psychology
Historical halving patterns suggest we're mid-cycle, not late-cycle. But with institutional money now dictating price action, old-school crypto analysts might as well be reading chicken bones.
The cynical take
Wall Street's latest 'digital gold' narrative conveniently ignores Bitcoin's 80% drawdowns—just like they ignore their own 2008 subprime meltdowns. Some things never change.
One thing's certain: when this coiled spring finally snaps, the move will be violent in both directions. Buckle up.
Bitcoin Cycle Sees Only 36 Days Of Real Gains
The current Bitcoin market cycle is being closely examined, as a new analysis by expert analyst Crypto Con delves deep into the cryptocurrency’s past movements, revealing two full years of sideways price action with only brief periods of upward momentum. The analyst’s chart, titled “Cycle 4 Ranges and Expansions,” highlights a pattern of prolonged range-bound activity interrupted by short bursts of expansion.
As of now, Crypto Con notes that bitcoin has been consolidating for 195 consecutive days since December 18, 2024, without setting a new local high. The chart analysis shows that the total time spent in actual upward expansion in the entire cycle is just 5.76 months. Even more interesting is the fact that when isolating the days in which Bitcoin recorded new local highs, the number shrinks to just 36 days.
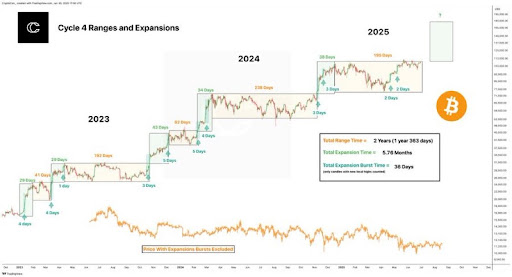
According to the market expert, these expansion bursts are responsible for all of Bitcoin’s significant price increases during its current cycle. Every expansion phase has also occurred within extremely narrow windows—typically just two to five days long. The rest of the cycle after this has been characterized by a consistent sluggish grind and long stretches of price consolidation, where momentum fades and the market struggles to advance.
Flattened Price Action Hides Cycles’ Underlying Strength
A closer look at the bottom section of Crypto Con’s chart, which removes the expansion bursts, shows how Bitcoin’s price has essentially remained flat or trended lower throughout the cycle. Major sideways phases in 2023 and 2024 lasted 192 days and 238 days, respectively, offering minimum sustained upside. The current 2025 range has now extended close to 200 days, continuing the trend of market inactivity.
Despite the drawn-out stagnation, Crypto Con maintains that this cycle is not over yet. He implies that Bitcoin’s prolonged accumulation and consolidation could be building pressure for a significant breakout. The chart also shows Bitcoin’s next potential upside target between $165,000 and $180,000. Currently the leading cryptocurrency is trading at $106,990, meaning a jump anywhere between these targets would represent price increase of over 54%.
If previous patterns hold, BTC’s next major MOVE may arrive swiftly, as past expansions have delivered their impact in just a few trading sessions. Until that moment arrives, Bitcoin remains locked in what is shaping up to be the slowest and possibly the most patient-testing cycle to date.
