Solana (SOL) Nears Make-or-Break Moment — Bulls Eye $142 as Critical Support

Solana's SOL teeters on the edge—again. The $142 level isn't just psychological; it's the last line of defense before bears turn this into another 'high-speed blockchain, low-speed recovery' meme.
Why $142 matters now
No fancy TA here: Hold above $142, and SOL could stage a relief rally sharp enough to make day traders forget last week's leverage massacre. Lose it? Cue the 'Solana is down' tweets from Ethereum maxis who still think gas fees are a flex.
The institutional whisper
Rumors swirl about hedge funds quietly accumulating at this level—because nothing screams 'conviction' like secretly buying the dip while telling clients to wait for 'better risk-reward.'
Bottom line
SOL's next move hinges on whether $142 holds. Either way, grab popcorn—this is crypto's version of a Netflix cliffhanger, just with more liquidations and fewer likable characters.
Solana Price Trims Gains
Solana price struggled to continue higher above $160 and started a fresh decline, like Bitcoin and Ethereum. SOL declined below the $155 and $152 support levels.
It even dipped below $150 and tested the $145 zone. A low was formed at $144 and the price is now correcting some losses. There was a MOVE above the 23.6% Fib retracement level of the downward move from the $160 swing high to the $144 low.
Besides, there was a break above a key bearish trend line with resistance at $147 on the hourly chart of the SOL/USD pair. solana is now trading below $150 and the 100-hourly simple moving average.
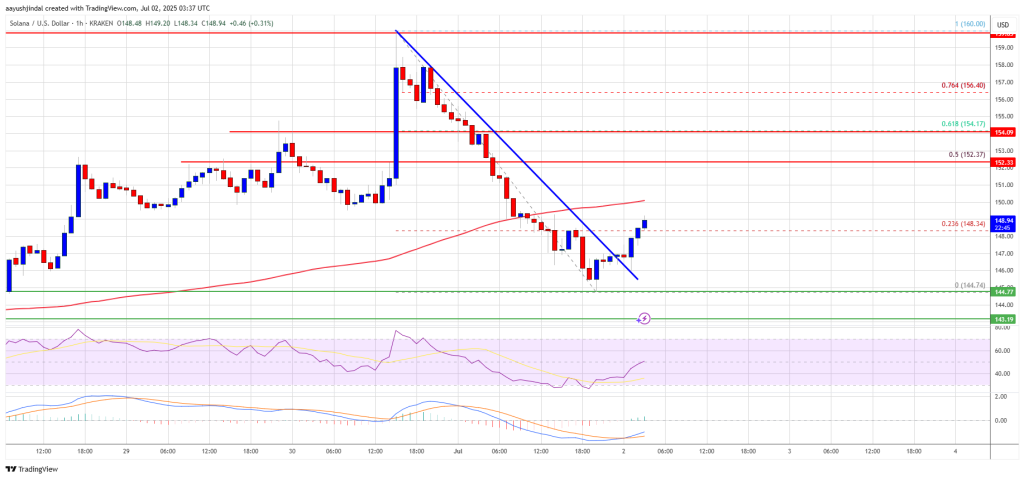
On the upside, the price is facing resistance NEAR the $150 level. The next major resistance is near the $152 level. It is close to the 50% Fib retracement level of the downward move from the $160 swing high to the $144 low. The main resistance could be $155. A successful close above the $155 resistance zone could set the pace for another steady increase. The next key resistance is $160. Any more gains might send the price toward the $165 level.
Another Decline in SOL?
If SOL fails to rise above the $150 resistance, it could start another decline. Initial support on the downside is near the $145 zone. The first major support is near the $142 level.
A break below the $142 level might send the price toward the $136 zone. If there is a close below the $136 support, the price could decline toward the $125 support in the near term.
Technical Indicators
Hourly MACD – The MACD for SOL/USD is losing pace in the bearish zone.
Hourly Hours RSI (Relative Strength Index) – The RSI for SOL/USD is above the 50 level.
Major Support Levels – $145 and $142.
Major Resistance Levels – $152 and $155.
