XRP Pulls Back From Peak — Is This The End of the Bull Run?

XRP's rally hits a speed bump as prices retreat from recent highs. Traders are left wondering: temporary dip or trend reversal?
Market jitters or healthy correction? The crypto's recent pullback sparks debate among analysts. Some see a buying opportunity, others fear deeper losses ahead.
Meanwhile, Wall Street 'experts' who called XRP dead at $0.30 are suddenly rediscovering blockchain technology. Funny how price movements affect institutional memory.
XRP Price Dips Further
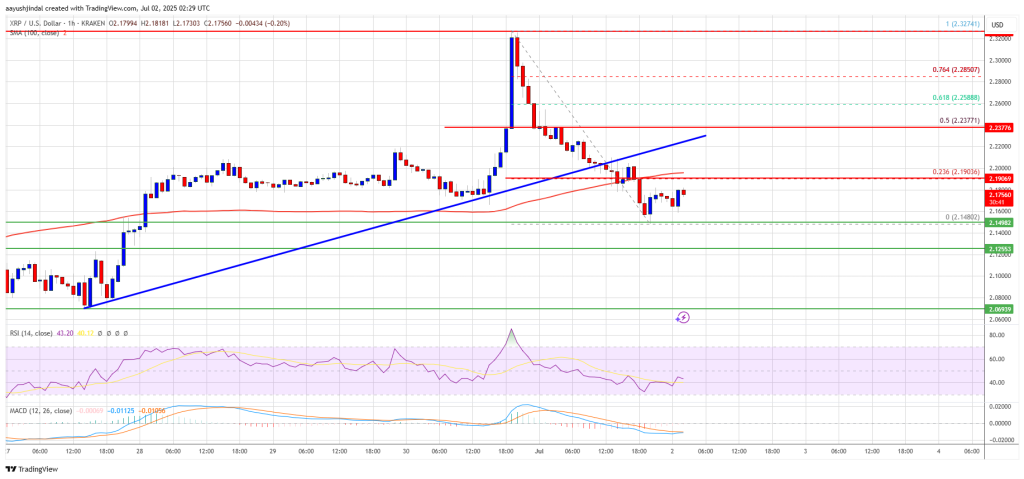
XRP price failed to extend gains above the $2.320 resistance and started a fresh decline, like Bitcoin and Ethereum. The price declined below the $2.250 and $2.220 support levels.
Besides, there was a break below a key bullish trend line with support at $2.20 on the hourly chart of the XRP/USD pair. The pair even spiked below the $2.150 level. A low was formed at $2.148 and the price is now consolidating losses below the 23.6% Fib retracement level of the downward MOVE from the $2.327 swing high to the $2.148 low.
The price is now trading below $2.220 and the 100-hourly Simple Moving Average. On the upside, the price might face resistance near the $2.20 level. The first major resistance is near the $2.220 level. The next resistance is $2.2380. It is close to the 50% Fib retracement level of the downward move from the $2.327 swing high to the $2.148 low.
A clear move above the $2.2380 resistance might send the price toward the $2.2850 resistance. Any more gains might send the price toward the $2.30 resistance or even $2.320 in the near term. The next major hurdle for the bulls might be $2.40.
Fresh Decline?
If XRP fails to clear the $2.220 resistance zone, it could start another decline. Initial support on the downside is near the $2.150 level. The next major support is near the $2.120 level.
If there is a downside break and a close below the $2.120 level, the price might continue to decline toward the $2.050 support. The next major support sits near the $2.020 zone.
Technical Indicators
Hourly MACD – The MACD for XRP/USD is now losing pace in the bearish zone.
Hourly RSI (Relative Strength Index) – The RSI for XRP/USD is now below the 50 level.
Major Support Levels – $2.150 and $2.120.
Major Resistance Levels – $2.220 and $2.2850.
