Bitcoin Profit-Taking Surges—But Still Trails Late 2024’s Greed Frenzy

Bitcoin's network just flashed a bullish signal—but traders aren't hitting the 'sell everything' button yet. Realized profits are spiking as BTC consolidates near all-time highs, yet the market's discipline suggests this rally has legs.
The ghost of FOMO past
Current profit-taking looks tame compared to late 2024's euphoria—when paper-handed traders dumped at the first sign of a 5% pullback. This time? Hodlers are playing the long game.
Wall Street's fomo meter
Traditional finance still can't decide if Bitcoin's a 'risk asset' or digital gold—meanwhile, the network keeps printing blocks (and profits) like a Swiss central banker on espresso.
Profit-Taking Accelerates As Bitcoin Battles Resistance
Bitcoin has experienced significant volatility in 2025, marked by aggressive price swings that have kept traders on edge. The past month alone has seen bitcoin surge to a new all-time high near $112,000 before retracing to a local low of $98,000. Despite this choppy action, the broader trend remains positive. Since rebounding from the $75,000 level in April, Bitcoin has climbed over 15%, with bulls maintaining control and defending key support zones.
This strength coincides with a broader risk-on environment, as the US stock market recently reached a new all-time high. Many analysts believe Bitcoin and the wider crypto market could be next in line to benefit from improved sentiment and increased investor appetite.
However, on-chain data from Glassnode reveals that profit-taking is ramping up again. Yesterday, realized profits on the Bitcoin network hit $2.46 billion, while the 7-day simple moving average (SMA) climbed to $1.52 billion. This figure sits well above the year-to-date average of $1.14 billion, suggesting a renewed wave of profit realization among investors. Still, these levels remain considerably lower than the $4–5 billion profit spikes seen during the peak frenzy of November and December 2024.
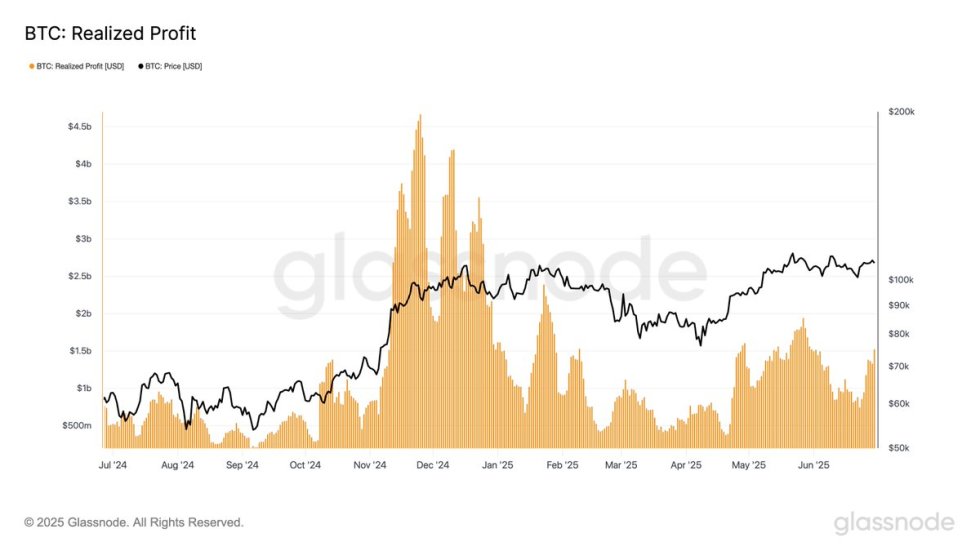
While these metrics don’t necessarily signal an immediate top, they reflect growing caution in the market. As Bitcoin hovers just below its all-time high, the balance between bullish momentum and investor profit-taking will be key in determining whether BTC breaks higher or retraces further in the sessions ahead.
BTC Struggles Below Critical Resistance
The 12-hour chart of Bitcoin shows a clear consolidation phase that began in early May. After a sharp rally above $100,000, BTC has been trading within a defined range, with key support at $103,600 and stiff resistance NEAR $109,300. Price briefly pushed above the 50- and 100-period moving averages, but strong selling pressure has continued to block any decisive breakout above the $109K zone.
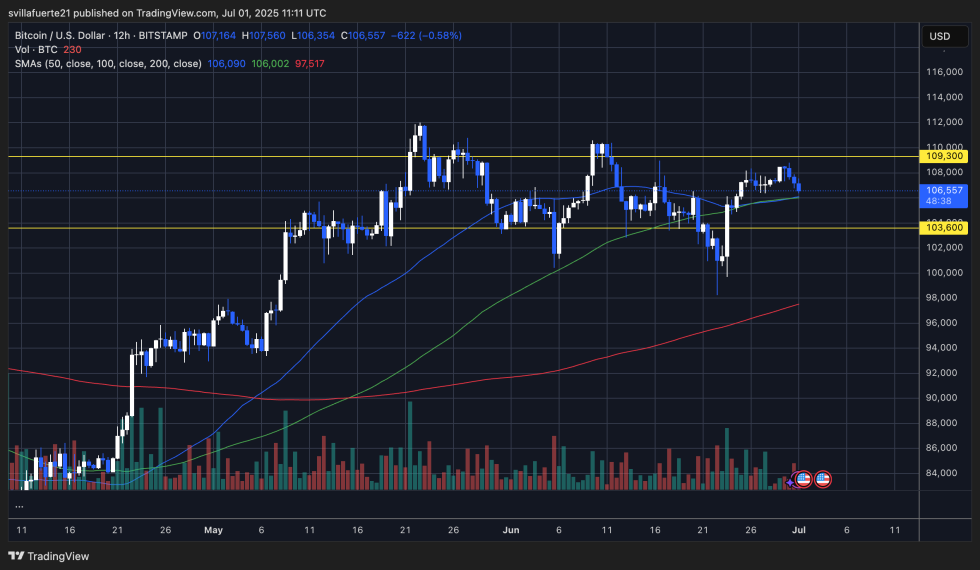
Currently, Bitcoin is trading at approximately $106,557, slightly below the short-term moving averages, suggesting a potential cooling-off period. Price action remains choppy, with multiple failed attempts to establish a clear trend. Despite bullish attempts to retest the upper resistance band, volume has not confirmed a breakout, and wicks above $109K indicate exhaustion at those levels.
The $106K mark—aligned with the 50 and 100 SMAs—is acting as a dynamic support, but a break below could quickly send BTC to retest the $103,600 level. On the upside, bulls must clear $109,300 with conviction to trigger a potential rally toward new all-time highs.
Featured image from Dall-E, chart from TradingView
