Bitcoin Bulls Stumble at Key Resistance — Can the Rally Regain Momentum?

Bitcoin's rally hits a wall as bulls fail to break through critical resistance. The king of crypto trims gains—leaving traders wondering if this is a temporary pause or the start of a deeper pullback.
### The Resistance Battle
After a strong run-up, Bitcoin faces stiff selling pressure near a key technical level. The bulls are losing steam—just as the market seemed ready to blast past the ceiling.
### What’s Next for BTC?
If history repeats, this could be another fakeout before a breakout. Or, as the skeptics love to say: 'Another day, another chance for crypto to humble overleveraged traders.'
### The Bottom Line
Volatility is back on the menu. Whether this dip gets bought or turns into a full-blown retreat depends on whether institutional FOMO can outweigh the usual summer liquidity crunch.
Bitcoin Price Dips Further
Bitcoin price failed to surpass the $108,800 resistance and started a fresh decline. BTC declined below the $107,000 level.
The bears even pushed the price below the $106,000 level. A low was formed at $105,116 and the price is now trading in a range below the 23.6% Fib retracement level of the downward move from the $108,792 swing high to the $105,116 low.
Bitcoin is now trading below $107,000 and the 100 hourly Simple moving average. On the upside, immediate resistance is NEAR the $106,000 level. There is also a bearish trend line forming with resistance at $106,000 on the hourly chart of the BTC/USD pair.
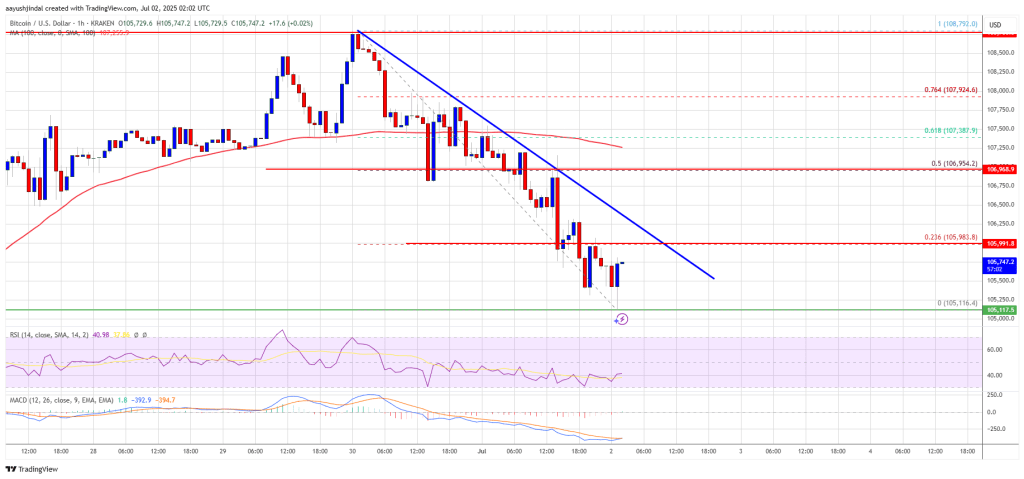
The first key resistance is near the $106,500 level. A close above the $106,500 resistance might send the price further higher. In the stated case, the price could rise and test the $107,000 resistance level. It is close to the 50% Fib level of the downward move from the $108,792 swing high to the $105,116 low. Any more gains might send the price toward the $108,000 level.
More Losses In BTC?
If Bitcoin fails to rise above the $106,500 resistance zone, it could start another decline. Immediate support is near the $105,500 level. The first major support is near the $105,000 level.
The next support is now near the $104,200 zone. Any more losses might send the price toward the $103,500 support in the near term. The main support sits at $102,000, below which BTC might continue to move down.
Technical indicators:
Hourly MACD – The MACD is now losing pace in the bearish zone.
Hourly RSI (Relative Strength Index) – The RSI for BTC/USD is now below the 50 level.
Major Support Levels – $105,500, followed by $105,000.
Major Resistance Levels – $106,500 and $107,000.
