Solana’s Bullish Flag Tightens — Is a 2025 Mega-Breakout Loading?

Solana's daily chart just printed a textbook bullish flag—and traders are leaning forward in their seats.
The Setup:
Tight consolidation after a steep rally signals exhaustion... or a coiled spring. With SOL's history of violent moves, the latter seems more likely (unless you're a perma-bear eating ramen in your mom's basement).
The Stakes:
A clean breakout could retest all-time highs, while failure traps late bulls. Watch volume: thin liquidity could amplify the move either way.
The Wildcard:
Macro winds are shifting. The Fed's 'soft landing' narrative looks shakier than a DeFi stablecoin—but crypto's been divorcing from traditional markets since 2024.
Buckle up. This flag's about to resolve.
Key Resistance Levels In Focus As Breakout Approaches
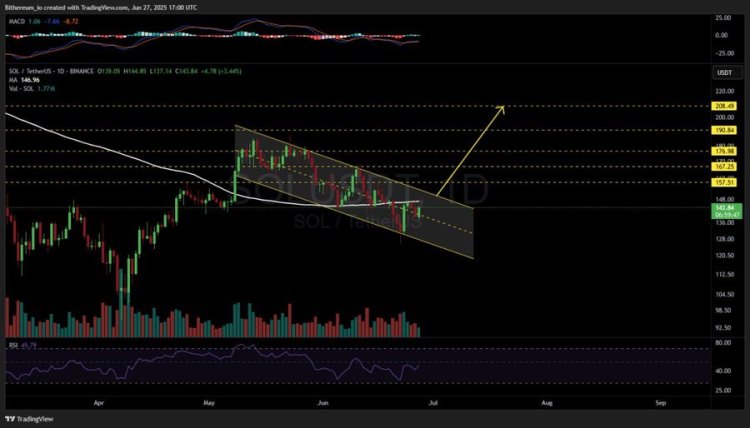
Solana has developed a bullish flag pattern on the daily chart, signaling a continuation of its uptrend. According to Dynamite Trader’s post on X, this pattern often precedes strong breakouts, suggesting that momentum could soon accelerate.
Currently, SOL’s price is holding above the midline of the flag, indicating underlying strength. However, it’s also testing the daily 100 moving average (MA100), which is acting as a dynamic resistance. SOL’s reaction to this level will be crucial in determining whether the bullish flag leads to a decisive breakout or a deeper consolidation.
Another analyst, Henry, highlighted that solana is gearing up for a big move after completing a clean Cup and Handle breakout on the 4-hour chart, a bullish pattern that signals continuation. The breakout saw SOL flip the $149 resistance into support, a key technical shift.
If this level holds, Henry sees a rally toward the $168 to $174 zone, which aligns with previous resistance levels and bullish extension targets. He adds a warning that volatility is increasing, and high-leverage positions are at risk on both sides.
Solana is setting up a clean wedge on the weekly chart. Currently trading at $150, SOL has been consistently bouncing between support and resistance levels, which is known for building pressure before delivering sharp moves.
Talking about this, Top G emphasizes that if this plays out as expected, the next leg up could be significant, and $300 isn’t just speculation; it’s a realistic target based on the structure and behavior.
Holding Above The Breakout Zone Could Accelerate The Move Upward
Solana has broken above the downtrend line on the 4-hour chart. This MOVE could mark a pivotal shift in short-term momentum, with potential bullish continuation if current levels hold.
If SOL maintains its position above this trend line, crypto analyst Bens BTC noted that the price could climb toward the next resistance area at $165. The price action is forming a bullish structure, and momentum indicators may soon align with the breakout, further supporting the continuation of the upside.
The asset had broken out with strong momentum and is now trading firmly within a long-term bullish channel, a structure that has supported uptrends. The price action looks clean, with higher highs and higher lows forming as SOL surges upward.
Furthermore, analyst Persis10t revealed that momentum is picking up, and as long as the channel remains intact, the path forward could be explosive. If the structure holds and attracts volume, Persis10t projects a target of $700+ in the next run, pointing to the upper boundary of the bullish channel as a magnet for price.

Log in to Reply
Log in to comment your thoughtsComments
Related Articles
|Square
Get the BTCC app to start your crypto journey
Get started today Scan to join our 100M+ users