Bitcoin’s 4-Year Inverse H&S Pattern Nears Neckline Break – Parabolic Rally Incoming?

Bitcoin's flirting with a technical breakout that could rewrite its price history. The 4-year inverse head-and-shoulders pattern—beloved by chartists and mocked by fundamentals-only traders—is approaching its make-or-break moment.
When the neckline cracks, things get interesting.
The Setup:
That inverse H&S has been quietly building since 2021's post-ATH carnage. Now, with institutional FOMO creeping back in, the pattern's completion could trigger algorithmic buying frenzies even your crypto-skeptic uncle can't ignore.
The Catch:
Neckline breaks demand volume. Without it, we're just watching another 'Wolf of Wall Street' GIF in chart form. (Bonus jab: Traders will still call it 'undervalued' at $200K if it pumps—classic.)
Buckle up. This is either the launchpad for Bitcoin's next leg up... or a masterclass in how TA turns hopeful squiggles into exit liquidity.
Bitcoin At A Critical Crossroads
Bitcoin is trading at a pivotal level that could determine the market’s next major MOVE — a breakout into new all-time highs or a retrace toward lower demand zones. After surging over 10% since last Sunday, the bullish sentiment is building rapidly, but the price remains stuck in a tight range between $100,000 and $110,000. Bulls are confident and in control of momentum, yet they’ve repeatedly failed to push BTC above the key $110K resistance. At the same time, bears have been unable to take the price below the $100K psychological support, signaling equilibrium and mounting pressure for a breakout.
This standoff has kept volatility high, with macroeconomic uncertainty and geopolitical instability adding fuel to the fire. Still, the current market structure appears constructive for Bitcoin. If bulls can finally break above the $110K level and push into price discovery, it WOULD confirm the strength behind this rally and potentially spark a new phase of exponential growth.
Carl Runefelt believes a major breakout may be on the horizon. His technical analysis reveals a massive inverse head and shoulders pattern forming over the last four years — a rare and highly bullish setup. According to Runefelt, traders should be “ready for a crazy pump” if Bitcoin breaks through the neckline NEAR $112K. Historically, this type of pattern precedes explosive rallies, and given the long-term nature of this one, the upside potential could be significant.
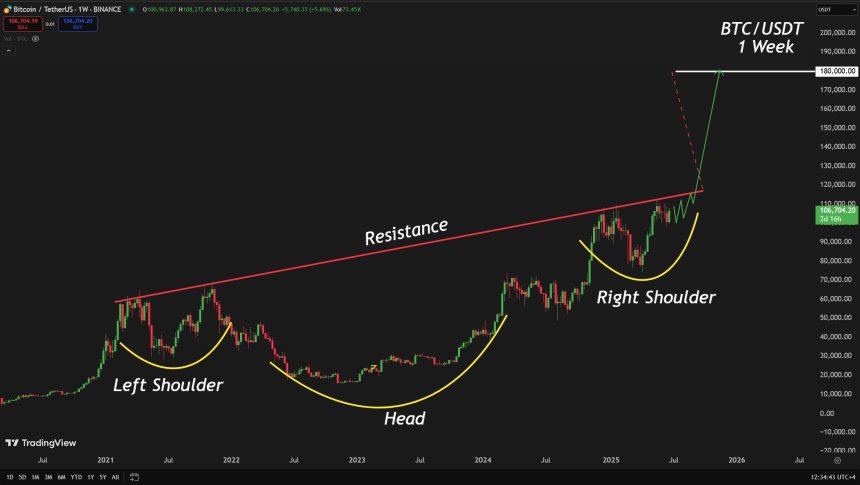
As long-term holders accumulate and market liquidity builds, the coming weeks may determine whether Bitcoin cements its breakout or returns to test deeper support. Either way, this moment is shaping up to be one of the most decisive junctures in the current bull cycle.
BTC Price Analysis: Key Resistance Blocks Price Discovery
Bitcoin is currently trading at $107,144 on the daily chart, showing modest gains but facing strong resistance as it nears the $109,300 level. The chart highlights a clearly defined horizontal structure between $103,600 and $109,300 — a range Bitcoin has respected for nearly two months. Bulls remain in control short term, having reclaimed all three major moving averages: the 50-day ($105,800), 100-day ($96,784), and 200-day ($96,136) SMAs.
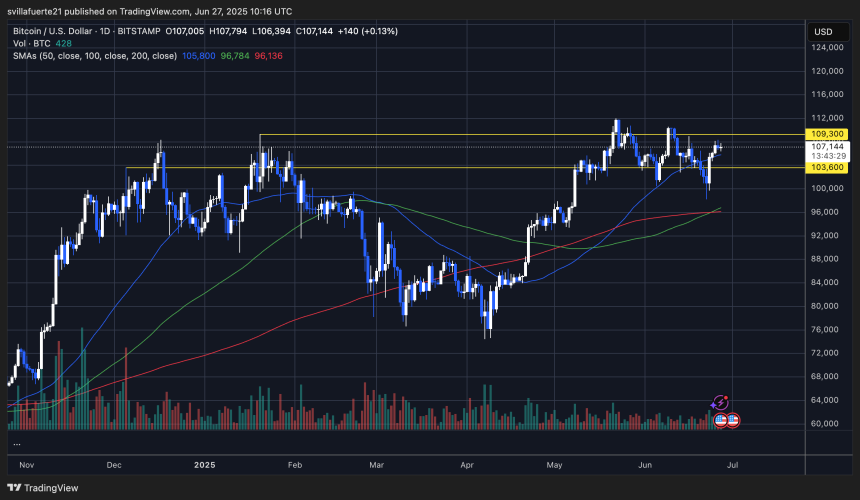
The most recent bounce off the $103,600 support zone was followed by rising volume, indicating a potential shift in momentum back to the upside. However, BTC has yet to close convincingly above $109,300, which continues to cap any price discovery attempts. A breakout above this level could open the door to new all-time highs and trigger an aggressive bullish continuation.
On the downside, failure to breach resistance and a drop below $105K could reintroduce bearish pressure and trigger a retest of the lower range. For now, Bitcoin remains range-bound with bullish bias, but buyers need to follow through with strong volume and a clean break above the $109K barrier to fully confirm market intent. Until then, caution is warranted as indecision prevails near key resistance.
Featured image from Dall-E, chart from TradingView

Log in to Reply
Log in to comment your thoughtsComments
Related Articles
|Square
Get the BTCC app to start your crypto journey
Get started today Scan to join our 100M+ users