Ethereum Plunges to $2,100—Why Top Analysts See a 185% Rocket to $6,000 Next

Blood in the crypto streets as Ethereum crashes to $2,100—but the smart money's already placing bets on the rebound.
Fear vs. Greed: The Contrarian Play
Retail traders panic-sold the dip while institutional wallets quietly loaded up. Sound familiar? It’s the oldest story in finance—just with more blockchain jargon this time.
The $6,000 Thesis
Three catalysts could fuel ETH’s next leg up: institutional ETF inflows (finally), Layer-2 adoption hitting escape velocity, and—let’s be honest—the inevitable FOMO cycle when Bitcoin makes its next run.
Warning: Past performance guarantees nothing except hedge fund PowerPoint slides. But if you’re not at least watching this setup, you’re not paying attention.
Wave A Complete, But Downside Likely Before Rally
The first detailed analysis came from @CryptoWaveV, a trader who uses Elliott Wave Theory to forecast market structure. According to his recent post, Ethereum’s price has now completed what he considers to be wave A of a larger corrective structure. His chart shows ethereum breaking down from a high around $2,900 and falling almost directly into a Fibonacci-based support zone between $2,134 and $1,957.
Now that the Wave A pattern is complete, the prediction is a short-term bounce to as high as $2,792 as part of a wave B retracement. However, this upward move would likely be temporary before another Wave C leg downward, which could drive the Ethereum price to as low as $1,706 before a meaningful bottom is confirmed.
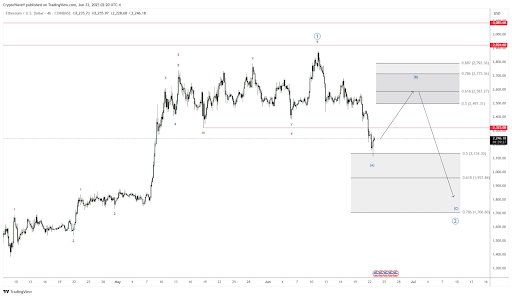
This level is what the analyst refers to as his “ideal buy zone” for long-term accumulation. Although the short-term view includes price crashes, a full bullish impulse will resume once this corrective phase is complete.
Wyckoff Structure Points $6,000 ETH Price
Merlijn, a popular analyst on X, shared a contrasting yet converging perspective. In this case, the analyst’s outlook is based on Wyckoff’s accumulation framework. Merlijn stated, “Ethereum: Wyckoff says go.”
According to the daily price chart that followed his analysis, the analyst showed that the crypto had already completed the spring and test phases, which are both components of a Wyckoff accumulation pattern. What comes next, according to the Wyckoff method, is the markup phase.
The chart Merlijn posted aligns with this outlook. The chart projected that Ethereum will reclaim a horizontal range between $2,150 and $2,450, followed by a steady progression above $3,850, and then another strong move past $4,800, before ultimately culminating around $6,800 to $7,000. This bullish setup suggests that while the recent dip to $2,100 might have shaken confidence, it may have served a larger structural purpose. The spring and test patterns imply a final shakeout of weak hands, clearing the path for long-term buyers to step in.
Finally, the outlooks from both analysts converge on a six-month to one-year trajectory that could see Ethereum breaking into the $6,000 range, if not higher. At the time of writing, Ethereum is trading at $2,420, up by 7.4% in the past 24 hours.
