Bitcoin Plunges 15% as Geopolitical Tensions Trigger Crypto Carnage

Fear grips digital asset markets as BTC nosedives below $50K
Black swan event or buying opportunity? Bulls battle bears amid volatility spike
Market makers flee to stablecoins—because nothing says 'safe haven' like algorithmic dollars
This bloodbath separates diamond hands from paper hands. Where do you stand?
Bitcoin Price Dips Further
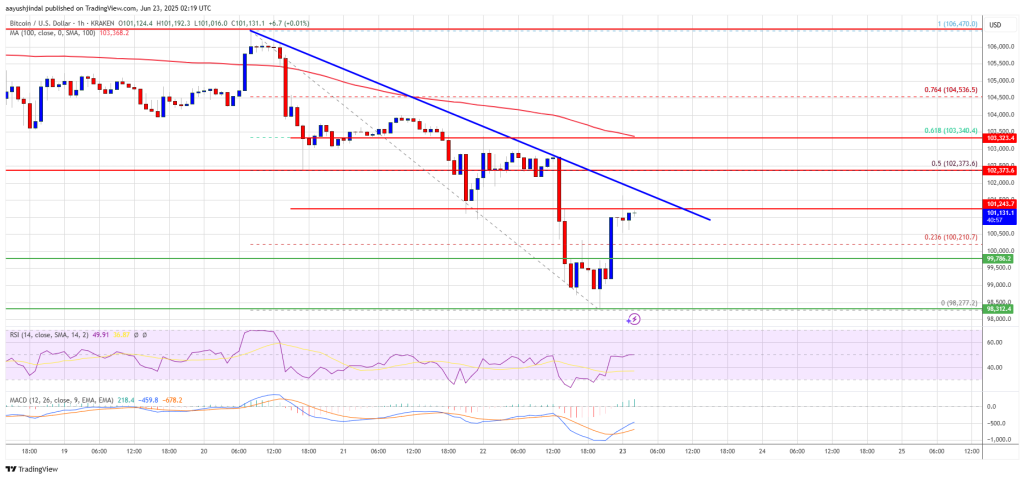
Bitcoin price started a fresh decline below the $105,500 zone. BTC gained pace and dipped below the $104,200 and $103,000 levels.
There was a clear MOVE below the $102,000 support level. Finally, the price tested the $98,250 zone. A low was formed at $98,277 and the price started a consolidation phase. There was a minor recovery above the 23.6% Fib retracement level of the downward move from the $106,470 swing high to the $98,277 low.
However, the bears were active below the $101,200 zone. Bitcoin is now trading below $102,000 and the 100 hourly Simple moving average. There is also a key bearish trend line forming with resistance at $101,250 on the hourly chart of the BTC/USD pair.
On the upside, immediate resistance is NEAR the $101,250 level. The first key resistance is near the $102,500 level or the 50% Fib retracement level of the downward move from the $106,470 swing high to the $98,277 low. The next key resistance could be $103,500.
A close above the $103,500 resistance might send the price further higher. In the stated case, the price could rise and test the $105,000 resistance level. Any more gains might send the price toward the $106,200 level.
Another Drop In BTC?
If bitcoin fails to rise above the $102,000 resistance zone, it could start another decline. Immediate support is near the $100,150 level. The first major support is near the $98,500 level.
The next support is now near the $96,500 zone. Any more losses might send the price toward the $95,500 support in the near term. The main support sits at $95,000, below which BTC might struggle to find bids.
Technical indicators:
Hourly MACD – The MACD is now losing pace in the bearish zone.
Hourly RSI (Relative Strength Index) – The RSI for BTC/USD is now below the 50 level.
Major Support Levels – $100,150, followed by $100,000.
Major Resistance Levels – $101,250 and $103,500.
