Ethereum Charts Scream ’Buy The Dip’ – Is This The Bottom Before The Next Rally?

Ethereum's price action is flashing signals that could make even the most jaded crypto trader sit up straight. After months of sideways movement, key technical indicators suggest ETH might be carving out a bottom.
Bulls vs. Bears: Who Blinks First?
The charts are setting up for a classic showdown. On-chain metrics whisper 'accumulation,' while shorts pile up like Wall Street bonuses before a crash. Every whale watching these levels knows the next big move could define Q3.
Gas Fees Tell Their Own Story
Network activity hasn't this quiet since your average banker tried explaining NFTs in 2021. But that's exactly when smart money starts making moves – when retail isn't looking.
The Cynic's Corner
Of course, if this is another false bottom, at least the 'fundamentals are strong' crowd will have fresh material for their Twitter threads.
Ethereum Holds Range As Market Awaits Decisive Break
Ethereum continues to trade within a tight consolidation range that began in early May, showing resilience despite growing global tensions and macroeconomic uncertainty. The price has hovered between $2,360 and $2,700, forming a narrow channel as buyers and sellers remain locked in a standoff. With conflicts in the Middle East intensifying and financial markets reacting to high interest rates and rising Treasury yields, crypto assets are under pressure, and Ethereum is no exception.
The long-anticipated altseason has yet to materialize, and Ethereum is widely seen as the key to unlocking that next phase. ETH’s dominance in the smart contract and DeFi space gives it a central role in leading altcoin market momentum. Traders and analysts are closely monitoring its current range, especially after M-log1 shared analysis suggesting the recent low at $2,360 could mark a local bottom.

According to M-log1, Ethereum is now consolidating just below the $2,450 level, and this zone could serve as a bullish trigger if reclaimed with strength. A decisive MOVE in either direction will likely set the tone for the broader crypto market, with a breakout above $2,500 potentially igniting the next leg upward.
Until then, market participants are watching closely. If ETH fails to hold these demand levels, the range could break to the downside, delaying any altseason rally further. But if bulls regain control and push above key resistance, it could signal the start of a much-anticipated upward move. In this environment of uncertainty, Ethereum’s next breakout-or breakdown—could prove pivotal for market sentiment heading into the second half of the year.
ETH Tests Key Support As Price Retraces
Ethereum is currently trading at $2,405, down 4.17% in the last session, after testing a low of $2,367. The chart reveals that ETH has retraced back to the lower boundary of a six-week range, confirming strong demand in the $2,360–$2,400 area. This zone has acted as a critical support level multiple times, with bulls stepping in each time to defend it.
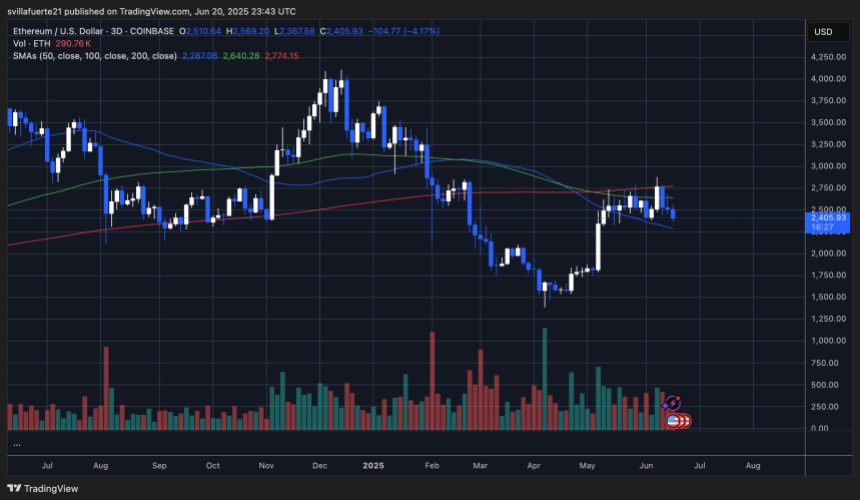
The price remains trapped below the 200-day moving average ($2,774), which has proven to be a strong resistance. Meanwhile, both the 50-day and 100-day moving averages are trending below price, currently sitting at $2,287 and $2,640, respectively, tightening the range even more. This compression typically leads to high volatility once a breakout occurs.
Volume has remained elevated during recent sessions, suggesting that buyers and sellers are actively competing for control. A decisive close below $2,360 could trigger a cascade toward $2,100 or lower. Conversely, if bulls manage to reclaim $2,500 and sustain momentum toward the $2,700–$2,800 resistance band, it may set the stage for a breakout.
Featured image from Dall-E, chart from TradingView
