SUI Primed for Explosive Rally: Falling Wedge Breakout Sets Sights on $5 Target

SUI shatters consolidation with a textbook bullish pattern—traders are flipping desks.
Technical breakout in play
The Layer 1 token just sliced through its falling wedge like a hot knife through butter. This isn't just another fakeout; the chart's screaming accumulation. Volume confirms the move, and liquidity pools are getting drained faster than a hedge fund's ethics.
Price targets locked
That $5 magnet zone? It's not hopium—it's simple geometry. Measured move projections from the wedge's trough to breakout point give conservative targets even your risk-averse grandma would approve. Shorts are about to get rekt harder than a 100x leverage position on a Binance glitch.
Market psychology at work
Watch for the classic three-step: denial at resistance, FOMO above it, then euphoria as bagholders finally break even. By then, the smart money's already rotated into the next play—probably some memecoin with a dog mascot and zero utility.
SUI Eyes Breakout To $5
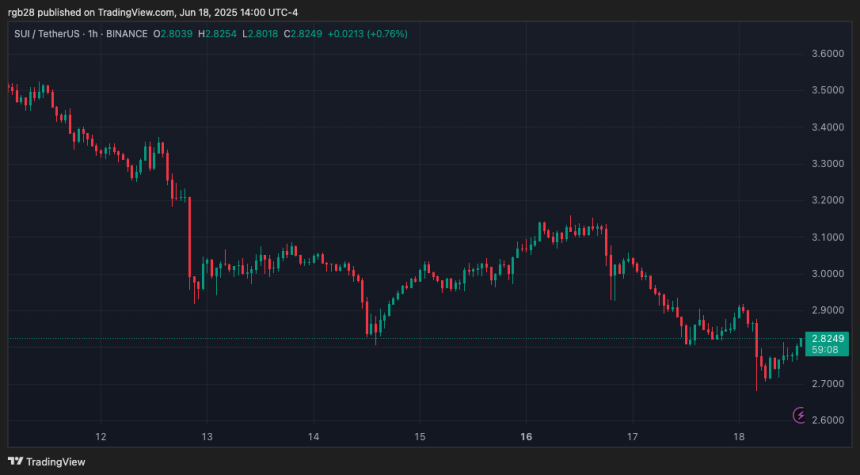
This week, SUI fell below the $3.00 mark amid the Israel-Iran news-fueled market retrace. The cryptocurrency has seen a 7% decline over the past three days, hitting a two-month low of $2.68 on Wednesday morning before recovering.
Since its late April breakout, SUI has been trading within the $2.33-$4.10 range, with the price hovering around the upper boundary over the past two months.
Notably, the altcoin ended its multi-month downtrend after breaking above its descending resistance at the end of March, leading to its rally to the $4.00 mark. On Wednesday, analyst crypto Bullet suggested that it could be preparing for a similar performance.
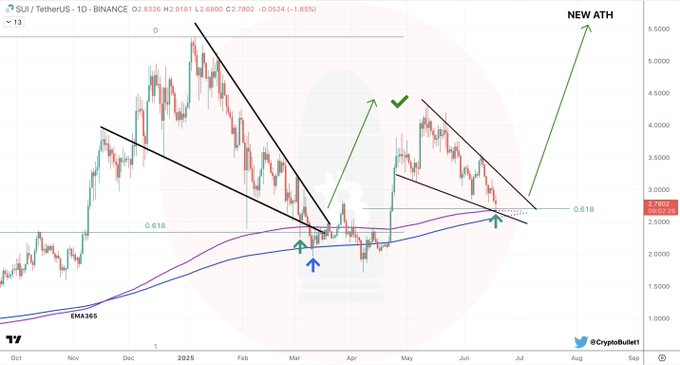
According to the post, SUI broke down a falling wedge pattern before bouncing off the yearly Exponential Moving Average (EMA) and Moving Average (MA) between March and April, which propelled the downtrend breakout and rally to its May high.
Now, the cryptocurrency is testing the EMA and MA again, while printing a new falling wedge pattern that targets the $5.00-$5.50 area. To Crypto Bullet, “This is where SUI is gonna establish a Higher Low and soon rise to a New ATH.”
Earlier this month, the analyst also highlighted a one-year rising wedge pattern that eyes the $8-$10 levels as the next major target for the cryptocurrency. The high-timeframe chart shows the altcoin has been hovering between the pattern’s upper and lower boundaries since early 2024.
Amid its April price action, the cryptocurrency bounced from the pattern’s support, suggesting that a surge to the resistance line will come in the coming months if history repeats.
Make-Or-Break Level Retest
Meanwhile, trader Coinvo noted that SUI is currently retesting a make-or-break level, the key $2.80 area, which acted as support and weak resistance earlier this year.
Holding this level is crucial for the cryptocurrency’s rally, as a drop could send the price toward the $2.33 range low and risk a potential retest of the $2.00 support.
On the contrary, price stability in this area could propel a reclaim of the $3.00 barrier and a recovery of the range highs, which is necessary for a bullish rally continuation. As analyst Rekt Capital previously warned, June’s performance will be decisive for its mid-term action.
It’s worth noting that SUI has built a re-accumulation range around the same levels as it did in late 2024. At the time, it consolidated around the $3.39-$3.78 levels for weeks before Weekly Closing above the range and setting up for its all-time high (ATH) breakout.
This time, the cryptocurrency has been consolidating less cleanly than last year, failing to secure a weekly close inside the range for two consecutive weeks. SUI must reclaim the $3.39 area in the coming weeks to maintain its Monthly Bull Flag and position itself for higher levels.
As of this writing, SUI is trading at $2.79, a 3.3% decline in the daily timeframe.