Solana Bubble Maps Flash Neutral – Is a SOL Summer Explosion Imminent?

Solana''s bubble maps just hit neutral—and traders are itching for the next move. After months of sideways action, could this be the calm before a SOL storm?
Market whispers suggest a summer rally brewing. But will it deliver—or just another ''to the moon'' promise that lands in the discount bin?
Technical indicators hover at equilibrium. No extreme greed, no panic selling. Textbook setup for a volatility spike.
Meanwhile, Ethereum killers keep multiplying—but Solana''s speed and meme-coin playground give it staying power. Even when gas fees elsewhere hit ''private jet'' levels.
One thing''s certain: Crypto never sleeps. And neither do the degens ready to FOMO in at the first green candle.
Solana Primed For A Spectacular Summer?
According to a recent CryptoQuant Quicktake post by contributor burakkesmeci, SOL is currently undergoing a cooling phase on both the spot and futures Bubble Maps. The analyst shared the following chart to highlight this cooling period.

For the uninitiated, a bubble map visualizes volume data across exchanges, with each bubble representing trading activity for a specific pair or platform. The size of the bubble indicates the total volume, while the color shows the intensity or change in that volume – such as cooling (green), neutral (gray), or overheating (red).
At first glance, lower trading volume might seem like fading momentum. However, the CryptoQuant analyst suggests this deceleration could be a strategic accumulation phase, particularly as a potential catalyst looms on the horizon.
Many in the crypto community are expecting the US Securities and Exchange Commission (SEC) to approve the first solana exchange-traded fund (ETF) in the coming weeks. In an X post published today, Eric Balchunas, Senior ETF Analyst at Bloomberg, said Solana could lead a “potential altcoin ETF summer.”
Meanwhile, predictions platform Polymarket currently places a 91% probability on a Solana ETF being approved in 2025 – the highest odds recorded since January of this year. Most speculators expect a SOL ETF to go live by July 2025.
From a technical standpoint, things are also looking encouraging. In a recent X post, crypto analyst Ali Martinez remarked that if SOL breaks above the $200 mark, it could kickstart a 5x to 10x bull run.
Martinez shared the following SOL weekly chart, which shows the digital asset forming a bullish Cup and Handle pattern. While the “cup” portion has already been completed, the emerging “handle” suggests the potential for significant price appreciation – possibly pushing SOL beyond $2,000.

SOL Showing Promise But Take Caution
Despite widespread optimism, some indicators urge caution. On-chain data recently revealed a large movement of dormant SOL coins, which has raised concerns about increased selling pressure in the NEAR term.
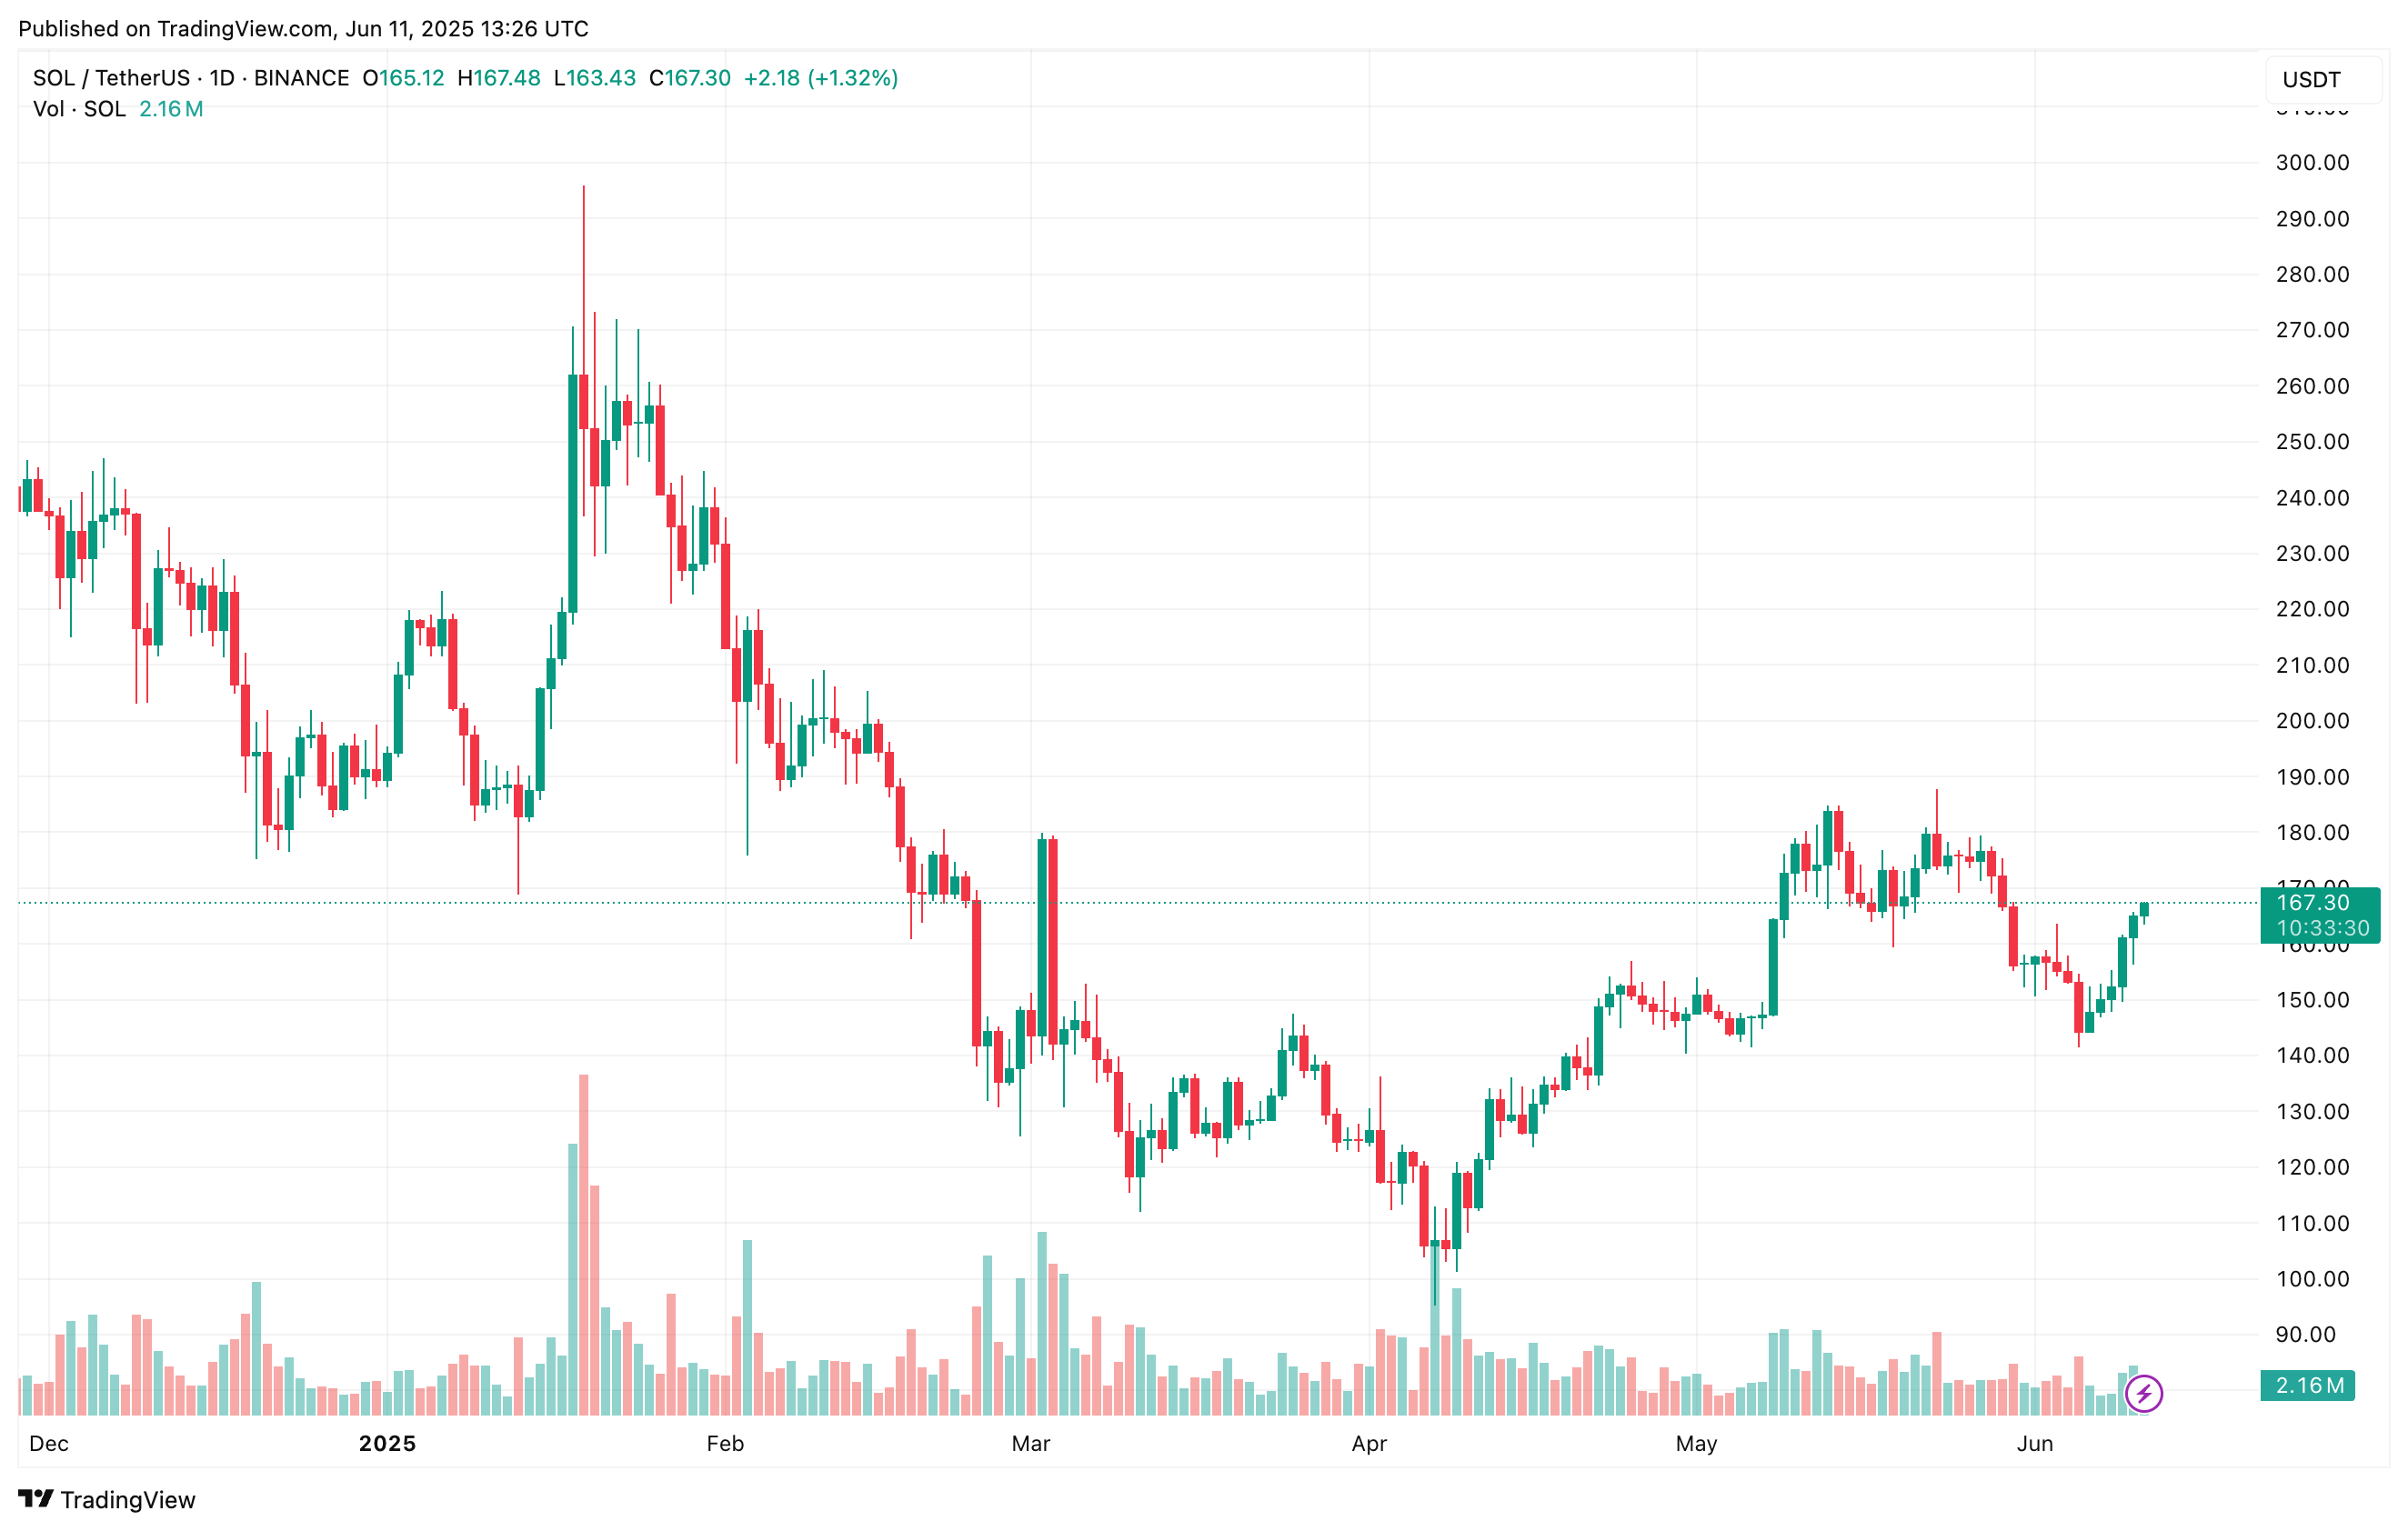
That said, a considerable number of analysts believe that SOL could surpass its current ATH of $293 later this year. At press time, SOL trades at $167.30, up 3.5% in the past 24 hours.