XRP Price Alert: Will History Repeat Its 2017 Bull Run?

Could XRP be gearing up for a déjà vu moment? If the 2017 fractal plays out again, we might be in for a wild ride.
Back then, Ripple's token skyrocketed—defying logic, gravity, and a fair bit of common sense. Traders who caught the wave raked in life-changing gains. But here's the kicker: past performance doesn't guarantee future results (though Wall Street loves pretending otherwise).
Market cycles have a funny way of rhyming—just ask anyone who's been rugged by 'this time it's different' hopium. If XRP's chart echoes 2017, buckle up. If not? Well, at least the volatility will keep things interesting.
2017 XRP Fractal Overlaid
Technical analysis of xrp price action on the weekly timeframe reveals an interesting pattern that has been unfolding over multiple weeks. This interesting pattern began with the intense XRP price rally in Q4 2024, which eventually ended in a consolidation around $2, as seen in the current price action. This, in turn, has led to the formation of a flag pattern that is still playing out.
The Core of the analyst’s technical analysis lies in the uncanny resemblance between XRP’s present market structure and the bullish pattern that preceded the historic 2017 rally. As such, the analyst overlaid the 2017 fractal onto the current price action, revealing a formation that mirrors a giant bull flag, which is often interpreted as a technical continuation pattern.
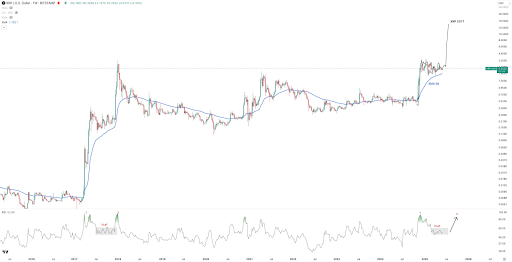
The analysis also places into focus XRP’s ongoing interaction with the 50-week exponential moving average (EMA) on the weekly candlestick timeframe. Back in 2017, this level acted as a support base for XRP’s vertical breakout. Now, the current pattern shows the cryptocurrency is once again consolidating directly above this moving average, which the analyst describes as the foundation of a giga bull flag.
The resemblance doesn’t stop at price structure. The analyst also draws attention to the RSI behavior. Back in 2017, the RSI entered a flat compressed zone between two spikes on the weekly timeframe, a pattern that appears to be repeating today. The first RSI peak has already formed, and the current flattening phase suggests a possible second spike may soon follow, which could correlate with a breakout in price if the fractal stays valid.
What To Expect If 2017 Fractal Plays Out Again?
The implications are exciting if XRP follows the same trajectory as it did in 2017. The overlay suggests a price rally beyond $20, which WOULD represent the biggest rally so far in XRP’s price history. The projected move would take XRP far beyond its 2018 all-time high of $3.40 and establish a new price floor above double digits for the cryptocurrency. This projection aligns with other projections in similar technical analyses from other cryptocurrency analysts.
At the time of writing, XRP is trading at $2.2, down by 2,3% in the past 24 hours. Whether or not XRP follows the 2017 pattern exactly remains to be seen, but the similarities in price behavior, RSI compression, and EMA support are difficult to dismiss.
