XRP Bulls Charge Toward Key Resistance—Can the Rally Hold?

Crypto traders are leaning into XRP’s momentum as prices push against a critical resistance level. The digital asset—forever caught between true believers and regulatory purgatory—is flirting with a breakout that could either validate the hype or become another ’buy the rumor, sell the news’ circus.
No fancy indicators needed here: when XRP moves, it does so with the subtlety of a sledgehammer. Watch for volume spikes—retail FOMO tends to kick in just before whales dump their bags.
If resistance cracks, prepare for the usual parade of ’I told you so’ tweets from crypto influencers who’ll conveniently forget their 2023 price predictions. Classic finance, but with more memes.
XRP Price Eyes Fresh Gains
XRP price remained stable above the $2.020 support and started a decent upward move, beating Bitcoin and Ethereum. There was a move above the $0.2120 and $0.220 levels.
The bulls were able to clear the 50% Fib retracement level of the downward wave from the $2.3540 swing high to the $2.2081 low. Besides, there was a break above a key bearish trend line with resistance at $2.20 on the hourly chart of the XRP/USD pair.
The price is now trading above $2.20 and the 100-hourly Simple Moving Average. On the upside, the price might face resistance NEAR the $2.2850 level. It is near the 76.4% Fib retracement level of the downward wave from the $2.3540 swing high to the $2.2081 low.
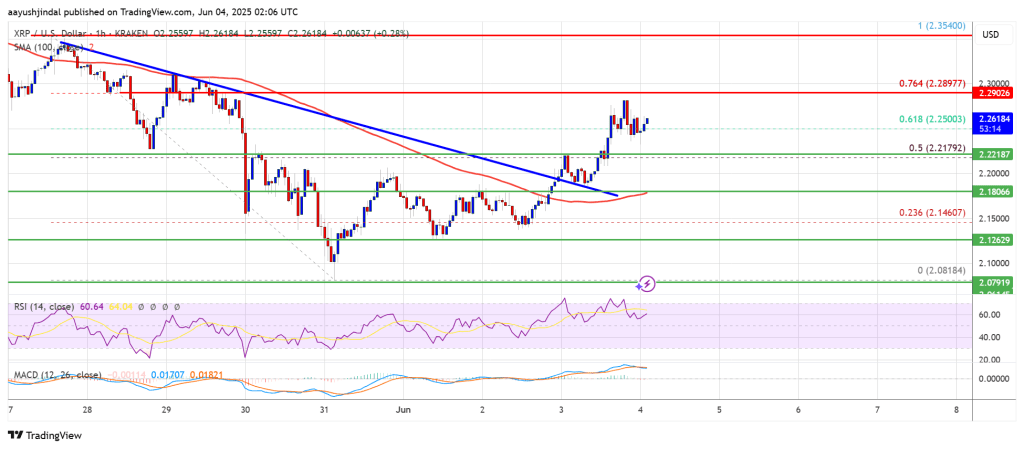
The first major resistance is near the $2.30 level. The next resistance is $2.320. A clear move above the $2.320 resistance might send the price toward the $2.350 resistance. Any more gains might send the price toward the $2.3650 resistance or even $2.3850 in the near term. The next major hurdle for the bulls might be $2.40.
Another Drop?
If XRP fails to clear the $2.30 resistance zone, it could start another decline. Initial support on the downside is near the $2.220 level. The next major support is near the $2.20 level.
If there is a downside break and a close below the $2.20 level, the price might continue to decline toward the $2.150 support. The next major support sits near the $2.120 zone.
Technical Indicators
Hourly MACD – The MACD for XRP/USD is now gaining pace in the bullish zone.
Hourly RSI (Relative Strength Index) – The RSI for XRP/USD is now above the 50 level.
Major Support Levels – $2.220 and $2.20.
Major Resistance Levels – $2.2850 and $2.30.

Log in to Reply
Log in to comment your thoughtsComments
Related Articles
|Square
Get the BTCC app to start your crypto journey
Get started today Scan to join our 100M+ users