Ethereum Defies Market Jitters as Daily Chart Screams Bullish – Here’s Why

While traditional markets flinch at every Fed whisper, Ethereum’s daily chart paints a defiant green streak. Analysts spot hidden strength in the noise—just don’t tell the Wall Street suits still trying to short Bitcoin with their 2018 playbooks.
Ethereum At A Pivotal Range: Bulls Eye Breakout
Ethereum is currently trading within a tight consolidation range that many investors view as the staging ground for its next major move. After a significant rally that saw ETH gain over 100% since April, the asset is now testing key resistance levels, particularly around $2,650–$2,700. Despite recent macroeconomic tensions, including rising US Treasury yields and persistent geopolitical risks, ethereum continues to show strength, with bulls holding the line above critical support.
Runefelt recently emphasized that Ethereum “refuses to dump on the daily timeframe,” a signal of underlying bullish resilience. His analysis suggests that if Bitcoin begins to move sideways, Ethereum could break out of its consolidation triangle to the upside, potentially sparking the beginning of a long-awaited altseason.

From a technical perspective, the consolidation appears constructive. The price has formed higher lows since April and remains above all major moving averages on key timeframes. The $2,300 level is emerging as a strong base, while the bullish target sits at $3,100 if resistance is cleared.
Runefelt’s bullish and bearish scenarios—$3,100 on the upside and $2,300 on the downside—underline the importance of the current range. As trading volume compresses and volatility brews, Ethereum looks ready for a decisive move. Should the breakout occur, it could not only lead ETH to new cycle highs but also ignite broader confidence across the altcoin market.
ETH Price Analysis – Daily Chart Overview
Ethereum (ETH) is currently trading at $2,616, hovering just below the 200-day simple moving average (SMA), which sits around $2,679. This level has acted as a consistent resistance zone over the past few weeks, with ETH failing to close decisively above it. Despite several intraday moves above $2,650, the price has yet to confirm a breakout.
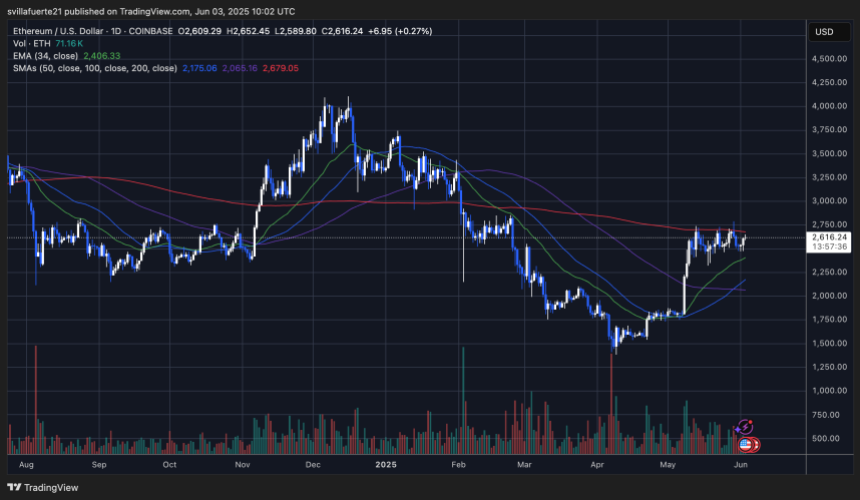
Looking at the broader structure, ETH remains in a consolidation range between $2,480 and $2,700 after posting an impressive rally from its April lows NEAR $1,800. The 34-day EMA ($2,406) and the cluster of shorter-term SMAs are trending upwards, indicating that medium-term momentum still favors the bulls.
Volume has been relatively stable but unremarkable, suggesting a lack of strong conviction from either side. A clean daily close above $2,700 could confirm a breakout and potentially open the door for a MOVE toward $3,000. On the downside, if ETH fails to hold the $2,480 support zone, we could see a pullback to retest the 100-day SMA near $2,065.
Featured image from Dall-E, chart from TradingView

Log in to Reply
Log in to comment your thoughtsComments
Related Articles
|Square
Get the BTCC app to start your crypto journey
Get started today Scan to join our 100M+ users