Solana Tumbles 13%—But Here’s Why Traders Are Secretly Smiling

Solana’s price just took a nosedive—down a brutal 13% in recent trading. Yet crypto degens aren’t sweating. In fact, one key indicator just flipped bullish, hinting at a potential rebound.
The Contrarian Signal Everyone Missed
While paperhands panic-sell, on-chain metrics reveal accumulation by whales. Classic ‘buy when there’s blood in the streets’ behavior—assuming you ignore the 90% of ‘institutional adoption’ press releases that are pure vaporware.
Short-Term Pain, Long-Term Game
Technical analysts point to oversold RSI levels and a historical support zone. Translation: dip-buyers are circling like vultures on a discount NFT fire sale. Whether this marks a bottom or just another trap in crypto’s endless psychological warfare? Only your portfolio manager—or astrologer—knows for sure.
Solana Has Seen A TD Sequential Buy Signal On The 12-Hour Timeframe
In a new post on X, analyst Ali Martinez has talked about a signal that has appeared on the 12-hour price chart of Solana. The signal in question is based on the Tom Demark (TD) Sequential, a technical analysis (TA) indicator commonly used to identify potential reversal points in an asset’s value.
The indicator involves two phases: setup and countdown. During the first of these, the setup, candles of the same color are counted up to nine. These nine candles don’t necessarily have to be consecutive. Once they are in, the TD Sequential flashes a reversal signal for the asset.
Naturally, if the candles were green (that is, an uptrend led into the signal), then the indicator suggests a bearish turnaround in the price. Similarly, red candles result in a bullish signal.
As soon as the setup is complete, the second phase, the countdown, begins. This phase works in much the same way, except for the fact that candles here go on until thirteen. Following these thirteen candles, the asset could be considered to have arrived at another location of likely reversal.
Now, here is the chart shared by the analyst that shows the TD Sequential signal that the 12-hour price of Solana has recently formed:

As is visible in the above graph, the 12-hour Solana price has recently completed a TD Sequential phase of the first type. Clearly, the nine candles involved in the pattern have been red ones, meaning that the indicator has just given a buy signal for the cryptocurrency. This signal has arrived after the asset has gone through a drawdown of more than 13% over the past week. It now remains to be seen whether it would be enough to help the coin find a bullish reversal or not.
While this bullish pattern has formed in TA, on-chain data may hint at a different outcome for Solana. According to cryptocurrency transaction tracker service Whale Alert, a SOL whale has just made a massive inflow to the Binance platform.
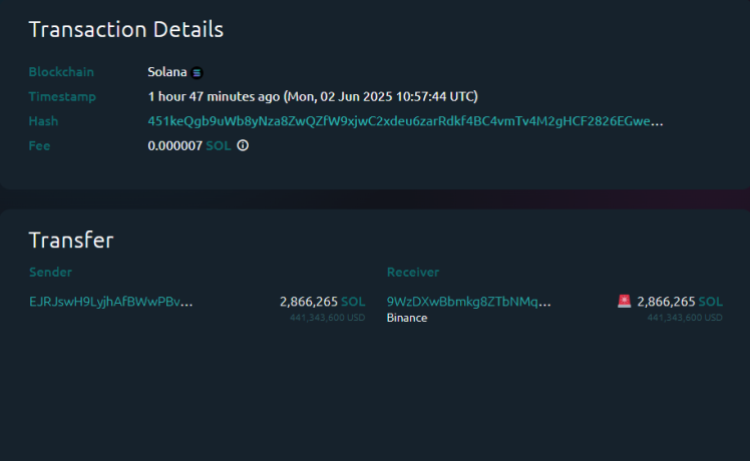
In total, the investor moved about 2.86 million tokens of the asset ($441 million) to the exchange with this transaction. Generally, holders transfer their coins to these central entities whenever they want to make use of one of the services that they provide, which can include selling.
Thus, if the motive behind this Binance deposit was distribution, then Solana can naturally see a bearish effect from the move, given its humongous scale.
SOL Price
Following its recent bearish trend, Solana has seen its price go down to $153.90.
