Bitcoin’s Bull Run Stays Alive—But Dials Back Moonboy Fantasies to $137K
Forget the hopium-fueled $200K dreams—Bitcoin’s next realistic peak now eyes $137,000 as institutional players keep the market on life support. The king coin still wears the crown, just with slightly less bling.
Analysts slash euphoric targets after months of sideways action, but the bulls aren’t running for the exits yet. Turns out even crypto needs to breathe between manic sprints.
And let’s be real—if Wall Street’s latest ’blockchain solutions’ PowerPoint can pump a shitcoin 300%, Bitcoin’s floor is basically diamond hands at this point.
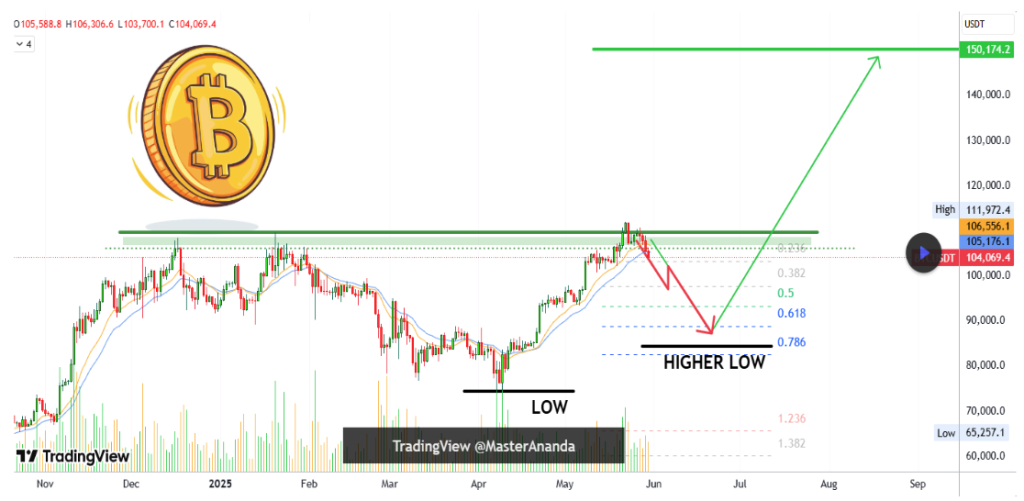
MasterAnanda Predicts Higher Low And $137,000 Target
In his TradingView post, MasterAnanda stated clearly that bitcoin is still in a bullish structure, but he believes a $200,000 peak is out of reach for this cycle. Instead, he identified $137,000 as the more realistic upside target when Bitcoin finally rebounds from the ongoing correction.
According to the analyst, the formation of a higher low on the larger time frame will be an important confirmation that Bitcoin’s macro uptrend remains intact. He outlined $88,888.88 as an ideal retracement level to make this perfect higher low, because it aligns with the 0.618 Fibonacci level and comes in well above the prior bottom at $74,500 on April 7.
Despite the current sell-off, MasterAnanda argues that the broader trend is healthy. “Bitcoin will never ever trade below $80,000 in its history again,” he declared, ruling out any DEEP reversal below the prior low.
On the other hand, the analyst also noted that if Bitcoin holds above $100,000 to $102,000, this retracement WOULD be considered minor, with price action still classified as bullish continuation rather than a breakdown.
If Bitcoin bulls manage to keep prices trading above that area, it would suggest the current MOVE is nothing more than a short-term dip. When that moment arrives, the bias will shift from short to long, and a rally to $137,000. However, a clean break below the $100,000 price level would mark a significant shift in how long Bitcoin reaches new highs.

Chart From TradingView: MasterAnanda
RLinda Echoes $101,000 Support For Bitcoin
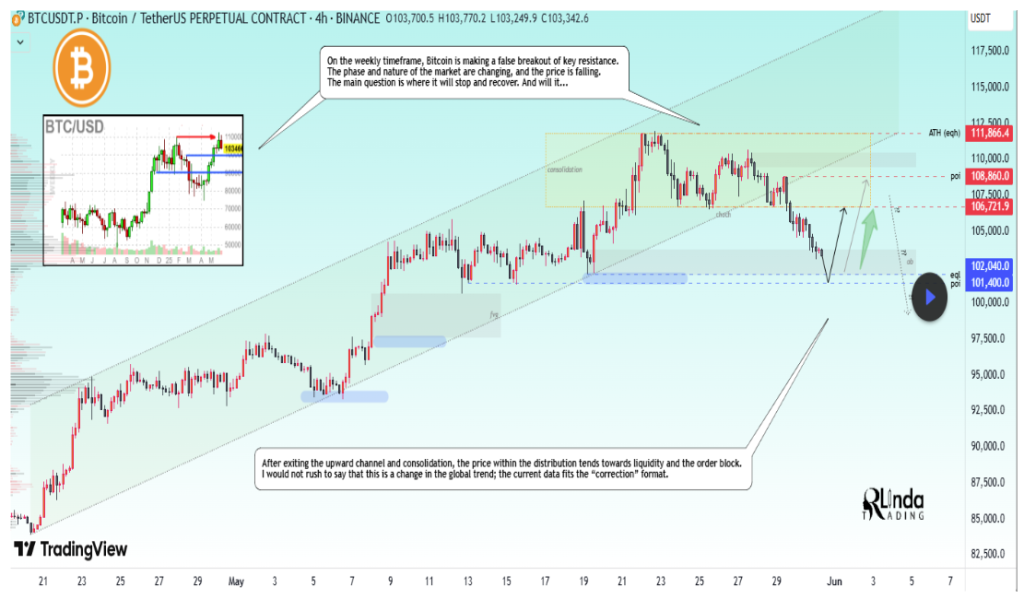
Adding to the analysis, another trader, RLinda, shared a 4-hour chart perspective showing how Bitcoin is currently in a fragile recovery path. She agrees that Bitcoin is still operating within a bullish context, but flagged the $102,000 and $101,400 zones as vital structural supports.
Her chart suggests that the false breakout at the key $110,000 resistance level is the end of the recent rally leg, and the current decline could be a liquidity-driven correction rather than a complete reversal of the bullish trend.
Furthermore, RLinda’s analysis shows that Bitcoin has exited its upward channel. The outcome, she said, will depend heavily on whether support levels at $102,000 and $101,400 can hold. A bounce from these levels could lead to a retest of the $106,000 to $108,000 resistance zone, where market direction may become clearer. If bulls fail to hold $101,000, it could invite a more dramatic sell-off that pushes the bitcoin price toward a local bottom or even deeper.

Chart Image From TradingView: RLinda
Together, both analysts agree on one thing: Bitcoin’s current correction is not yet a full collapse. At the time of writing, Bitcoin is trading at $104,290, up by 0.5% in the past 24 hours.
Featured image from Unsplash, chart from TradingView

