Ethereum Recoils from $2,700—20-Day Moving Average Becomes Make-or-Break Zone

Ethereum bulls just got a cold shower. After failing to hold above $2,700, ETH now tests critical support at its 20-day moving average—the line between a healthy pullback and deeper correction.
The $2,700 Ceiling Strikes Again
Another rejection at this psychological resistance level leaves traders questioning whether institutional money (or just leveraged retail degens) will step in to defend the 20DMA. Technicals hint at exhaustion, but chain data shows stubborn hodler accumulation.
Watch the Bounce—Or Lack Thereof
If this key trendline cracks, prepare for a sweep of recent lows. Meanwhile, crypto Twitter oscillates between ’buy the dip’ and ’the Fed killed the bull market’—because apparently macro matters only when prices drop. Classic.
Ethereum At A Pivotal Level As Bulls Defend Support
Ethereum is facing a crucial test as it struggles to reclaim higher prices and confirm a sustained uptrend. After multiple attempts to break above the $2,700 resistance zone, the price has been met with volatility, creating a choppy environment that reflects broader uncertainty in the crypto market. Despite this, analysts remain optimistic about Ethereum’s prospects, especially as altseason chatter grows louder.
Cheds recently shared a key insight: Ethereum is now back at its 20-day moving average (DMA) after briefly surging above the $2,700 range. This push met the underside of the 200-day simple moving average (SMA), creating a confluence zone that could act as the launchpad for the next rally, or the line in the sand that decides short-term direction. Holding this DMA support is critical. If bulls defend this level, it could signal renewed strength and spark a breakout that sends ETH back toward $3,000 and beyond.
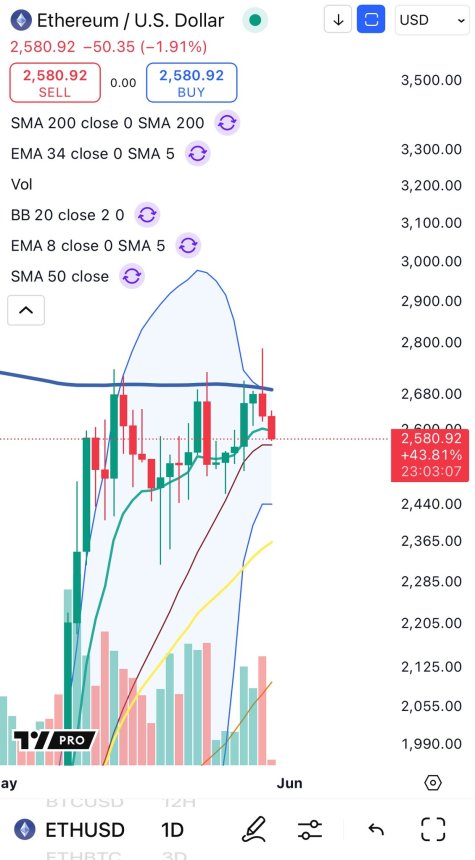
Amid rising speculation and technical pressure, Ethereum’s current structure still leans bullish. It’s maintaining higher lows and continues to show signs of accumulation, which supports the thesis of a possible altseason in the NEAR future. If BTC stabilizes and ETH clears resistance, the entire market could shift upward rapidly.
Ethereum Tests Support At Key Short-Term Levels
Ethereum is consolidating on the 4-hour chart as it hovers around $2,614, following a minor pullback from the $2,780 local top. The chart shows ETH retesting the 34-period EMA (currently near $2,624) and finding short-term support along the confluence of the 50 and 100-period SMAs. These moving averages are acting as a dynamic support band that has held firm during previous retracements in May.
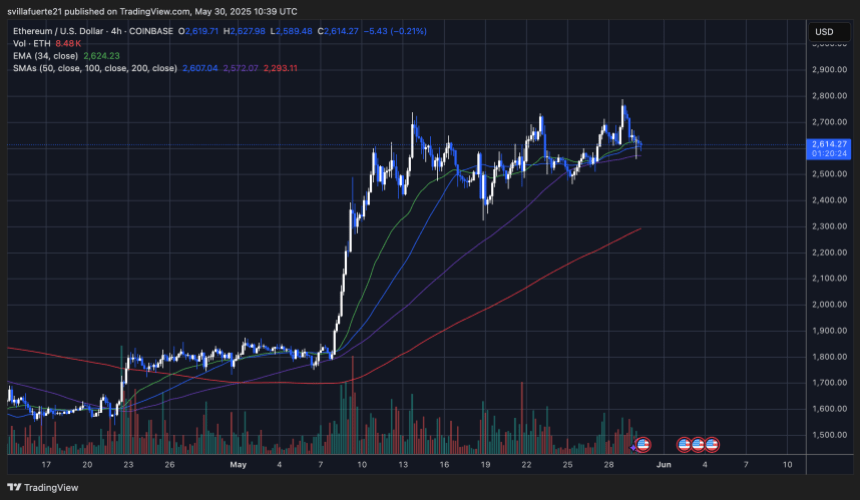
The structure remains bullish overall, with higher lows maintained since the breakout on May 9. However, the current price action is forming a tightening wedge pattern, which suggests that a breakout—either up or down—is imminent. Volume has been declining slightly, indicating a potential pause before a decisive move.
For bulls, holding above the $2,580–$2,600 zone is critical. A clean bounce from here could set up another attempt to break the $2,700–$2,800 resistance area. On the flip side, a break below the 100 SMA could expose ETH to a deeper retracement toward $2,500 or even the $2,400 zone if selling pressure accelerates.
Featured image from Dall-E, chart from TradingView

Log in to Reply
Log in to comment your thoughtsComments
Related Articles
|Square
Get the BTCC app to start your crypto journey
Get started today Scan to join our 100M+ users