Bitcoin’s Make-or-Break Moment: Trump Tariff Turmoil Sparks $106K Crash Fears—Or Run to New ATH?

Markets reel as Bitcoin teeters on a knife’s edge—will Trump’s tariff bombshell trigger a nosedive to $106K or fuel the next record-breaking rally?
Subheader: The Tariff Tango
Politics meets crypto volatility—again. Fresh trade war tremors send shockwaves through digital asset markets, leaving traders scrambling to parse the fallout.
Subheader: Technical Tightrope
BTC’s chart paints a binary picture: breakdown through critical support at $106K or another gravity-defying leap past all-time highs. No middle ground.
Subheader: Institutional Whiplash
Hedge funds flip from ’buy the dip’ to ’dump everything’ faster than a politician backpedals on campaign promises—welcome to modern portfolio management.
Closing Thought: Whether this becomes Bitcoin’s Icarus moment or just another bump on the road to mainstream adoption depends entirely on whether Wall Street remembers its own playbook—or gets spooked by its shadow.
Bitcoin Compression Structure Between Fair Value Gaps
According to crypto analyst TehThomas, Bitcoin’s current price structure is defined by two opposing 1-hour fair value gaps (FVGs). The lower FVG zone identified by the analyst is around $107,500, which showed up during the rally towards $111,814 ATH and is now acting as the first significant reaction point post-rally.
The upper FVG range is between $109,800 and $110,700. This level, previously the base of a breakdown candle, flipped into strong resistance on Friday. Interestingly, a rejection was confirmed inside this upper FVG, which showed there were many sellers present in that zone.
Notably, the 1-hour chart shared by the analyst points to a deadlock scenario for the Bitcoin price. A breakout above or below the identified fair value gaps will likely define the directional bias for Bitcoin’s next major leg.
Bitcoin’s next impulsive move will likely come with volume confirmation, either with a bullish displacement above resistance or a bearish rejection that pushes the Bitcoin price toward a lower demand target.
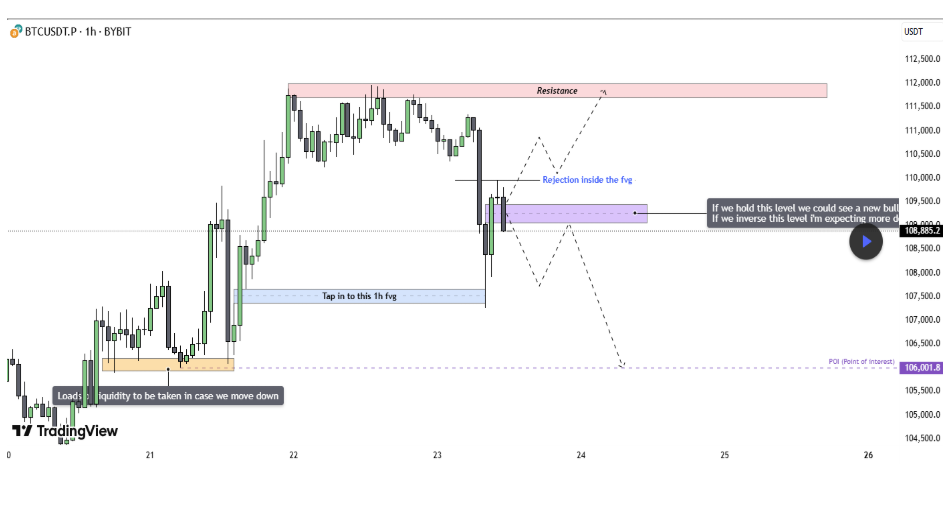
Chart Image From TradingView
Bullish And Bearish Scenarios For Bitcoin
Interestingly, since the analysis, the ensuing price action has been marked by Bitcoin’s failure to reclaim the upper FVG and more of a consolidation around the lower FVG at $107,500. This places the most significance around this level, as Bitcoin’s reaction here could either cause a rebound upwards or a significant price retracement.
For the bullish scenario, a bounce at the lower FVG will send the bitcoin price towards the upper FVG. A sustained move above the upper FVG at $110,700 would indicate a bullish reclaim and might bring a new all-time high around $113,000 back into focus.
For the bearish scenario, especially with a clean loss of the $107,500 level, the path opens for a MOVE toward $106,000. This level is aligned with a liquidity pool left behind from consolidation early last week. If the structure breaks downward below $106,000, sellers may seize control in the short term.
At the time of writing, Bitcoin was trading at $107,017.
Featured image from Unsplash, chart from TradingView
