XRP Tightens Like a Spring—Is a Explosive Rally Next?

XRP’s price action has coiled into a tightening pattern—classic breakout fuel. Traders are leaning forward, fingers hovering over buy orders.
The Setup:
After months of sideways grinding, XRP’s volatility compression mirrors pre-pump conditions from late 2023. The 50-day and 200-day MAs are nearly kissing—a convergence that’s historically preceded 30%+ moves.
The Catalyst Question:
With Ripple’s legal overhang reduced (though not gone), the market’s pricing in clearer skies. But let’s be real—this is crypto. A single whale’s mood swing could trigger the move before any ’fundamentals’ matter.
The Bottom Line:
Break above $0.60 and shorts get squeezed like a Wall Street intern during earnings season. Fail to hold $0.52? Another ’patiently waiting for adoption’ narrative takes over. Place your bets—the market certainly is.
XRP Price Eyes Upside Break
XRP price started a fresh decline below the $2.420 zone, unlike Bitcoin and Ethereum. There was a move below the $2.40 and $2.3650 levels. The price tested the $2.3150 zone.
A low was formed at $2.3157 and the price is now attempting to recover. There was a MOVE above the $2.335 and $2.350 levels. The price tested the 50% Fib retracement level of the downward move from the $2.4068 swing high to the $2.3157 high.
However, the price now faces hurdles NEAR the $2.3650 level. There is also a connecting bearish trend line forming with resistance at $2.3620 on the hourly chart of the XRP/USD pair.
The price is now trading near $2.35 and the 100-hourly Simple Moving Average. On the upside, the price might face resistance near the $2.3650 level. The first major resistance is near the $2.3850 level. It is near the 76.4% Fib retracement level of the downward move from the $2.4068 swing high to the $2.3157 high.
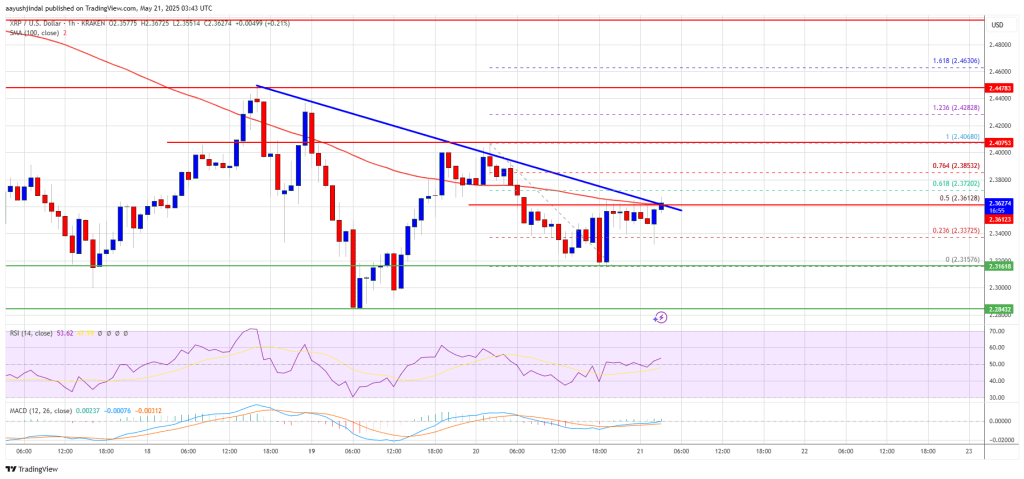
The next resistance is $2.420. A clear move above the $2.420 resistance might send the price toward the $2.450 resistance. Any more gains might send the price toward the $2.50 resistance or even $2.550 in the near term. The next major hurdle for the bulls might be $2.650.
Another Decline?
If XRP fails to clear the $2.420 resistance zone, it could start another decline. Initial support on the downside is near the $2.3150 level. The next major support is near the $2.30 level.
If there is a downside break and a close below the $2.30 level, the price might continue to decline toward the $2.220 support. The next major support sits near the $2.20 zone.
Technical Indicators
Hourly MACD – The MACD for XRP/USD is now losing pace in the bearish zone.
Hourly RSI (Relative Strength Index) – The RSI for XRP/USD is now above the 50 level.
Major Support Levels – $2.3150 and $2.30.
Major Resistance Levels – $2.420 and $2.50.

Log in to Reply
Log in to comment your thoughtsComments
Related Articles
|Square
Get the BTCC app to start your crypto journey
Get started today Scan to join our 100M+ users