Solana (SOL) Stalls in No-Man’s Land — Traders Awake the Sleeping Giant

Solana’s price action flatlines like a Wall Street intern during earnings season—stuck in a tight range that’s testing traders’ patience. The blockchain’s native token (SOL) refuses to commit, dangling between support and resistance like a hedge fund manager’s moral compass.
The Waiting Game: With volatility squeezed drier than a DeFi protocol’s liquidity pool, SOL’s next move could trigger a cascade of algorithmic trades. Watch for a breakout above $180 or breakdown below $160—the kind of binary event that turns crypto Twitter into a gladiator arena.
Network Health Check: Behind the price stagnation, Solana’s tech stack keeps humming. Transaction speeds still leave Ethereum gas fees weeping in a corner, though the ’NFT drop congestion’ PTSD lingers among degens.
Market makers are coiled tighter than a spring—when SOL picks direction, it’ll move like an altcoin with something to prove. Just don’t expect Wall Street analysts to notice until after the 200% pump (or 80% rug).
Solana Price Recovers Above $165
Solana price formed a base above the $160 support and started a fresh increase, like Bitcoin and Ethereum. SOL gained pace for a move above the $162 and $165 resistance levels.
There was a clear MOVE above the 50% Fib retracement level of the downward move from the $177 swing high to the $160 low. Besides, there was a break above a connecting bearish trend line with resistance at $167 on the hourly chart of the SOL/USD pair.
However, the bears were active NEAR the $172 resistance zone. The 76.4% Fib retracement level of the downward move from the $177 swing high to the $160 low is acting as a resistance.
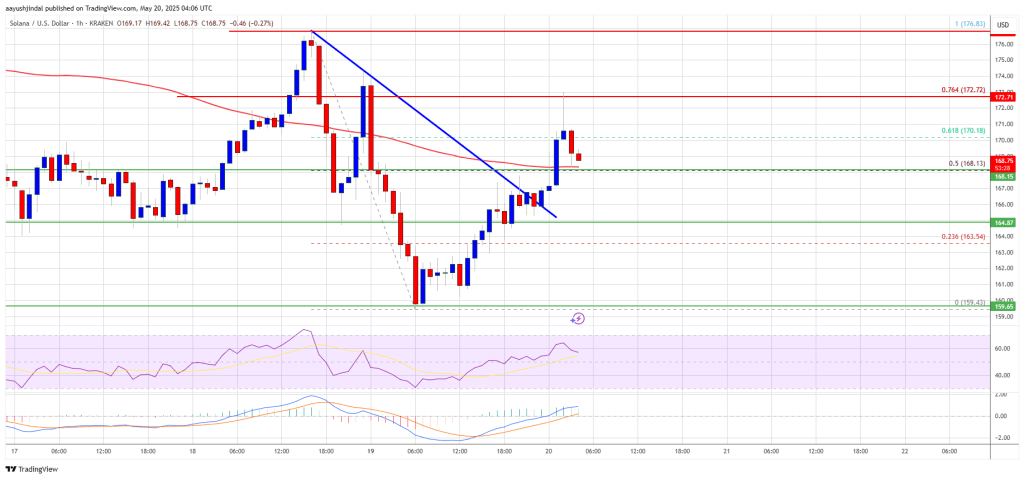
Solana is now trading above $168 and the 100-hourly simple moving average. On the upside, the price is facing resistance near the $172 level. The next major resistance is near the $176 level. The main resistance could be $180. A successful close above the $180 resistance zone could set the pace for another steady increase. The next key resistance is $192. Any more gains might send the price toward the $200 level.
Another Decline in SOL?
If SOL fails to rise above the $172 resistance, it could start another decline. Initial support on the downside is near the $168 zone. The first major support is near the $165 level.
A break below the $165 level might send the price toward the $162 zone. If there is a close below the $162 support, the price could decline toward the $150 support in the near term.
Technical Indicators
Hourly MACD – The MACD for SOL/USD is losing pace in the bullish zone.
Hourly Hours RSI (Relative Strength Index) – The RSI for SOL/USD is above the 50 level.
Major Support Levels – $165 and $162.
Major Resistance Levels – $172 and $176.
