Bitcoin Teases Historic Breakout—Charts Flash Bullish Signals for All-Time High Run

Bitcoin’s price action is coiled like a spring—technical indicators suggest an imminent thrust toward record highs. Traders are watching key resistance levels with the intensity of Wall Street bankers eyeing their third yacht.
The setup: A textbook pennant formation on the weekly chart, paired with rising volume, signals explosive upside potential. MACD crosses bullish while RSI avoids overbought territory—classic breakout fuel.
What’s next? Either a rejection that crushes overleveraged longs (again), or a parabolic rally that leaves skeptics scrambling. Either way, the charts are screaming louder than a crypto influencer with a new ’sure thing’ altcoin.
Bitcoin Price Starts Fresh Surge
Bitcoin price started a fresh increase from the $102,000 support zone. BTC formed a base and was able to clear the $104,200 resistance zone. The bulls pushed the price above $105,000.
There was a clear MOVE above the 50% Fib retracement level of the downward move from the $107,042 swing high to the $102,100 low. It opened the doors for a move above the $106,000 resistance zone.
The current price action is positive since the price settled above the 76.4% Fib retracement level of the downward move from the $107,042 swing high to the $102,100 low. There is also a short-term bullish trend line forming with support at $105,800 on the hourly chart of the BTC/USD pair.
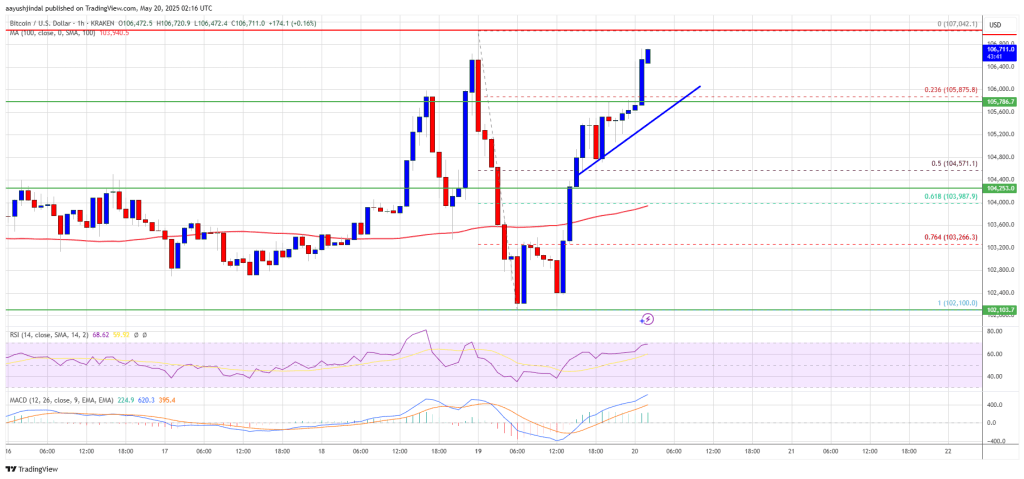
Bitcoin is now trading above $105,500 and the 100 hourly Simple moving average. On the upside, immediate resistance is NEAR the $107,000 level. The first key resistance is near the $107,200 level. The next key resistance could be $107,500. A close above the $107,500 resistance might send the price further higher. In the stated case, the price could rise and test the $108,800 resistance level. Any more gains might send the price toward the $110,000 level and a new all-time high.
Another Drop In BTC?
If Bitcoin fails to rise above the $107,000 resistance zone, it could start another correction. Immediate support on the downside is near the $105,800 level. The first major support is near the $105,000 level.
The next support is now near the $104,200 zone. Any more losses might send the price toward the $103,500 support in the near term. The main support sits at $102,500, below which BTC might gain bearish momentum.
Technical indicators:
Hourly MACD – The MACD is now gaining pace in the bullish zone.
Hourly RSI (Relative Strength Index) – The RSI for BTC/USD is now above the 50 level.
Major Support Levels – $104,200, followed by $103,500.
Major Resistance Levels – $107,000 and $107,500.

Log in to Reply
Log in to comment your thoughtsComments
Related Articles
|Square
Get the BTCC app to start your crypto journey
Get started today Scan to join our 100M+ users