Bitcoin Nears ATH—Will Bulls Break Through or Face Another ’Institutional FOMO Trap’?

BTC flirts with record highs as retail traders hold their breath—just as Wall Street quietly loads up OTC bags. Again.
Key drivers: Spot ETF inflows hit $2B/month, but derivatives open interest screams overheated. Macro tides favor risk assets... until the next CPI print ’surprises’ economists.
The real question: Does this rally have staying power, or are we setting up for the classic ’sell-the-news’ massacre post-ATH? (Spoiler: The whales already know.)
Bitcoin Price Extends Gains
Bitcoin price started a fresh increase from the $102,500 support zone. BTC formed a base and was able to clear the $103,500 resistance zone. The bulls even pushed the price above $104,200.
The bulls even pumped the price above $105,000. A high was formed at $107,042 and the price is now correcting gains. There was a MOVE below the $105,500 level. The price dipped below the 50% Fib retracement level of the upward move from the $103,346 swing low to the $107,042 high.
However, it is stable above $104,000. There is also a key bullish trend line forming with support at $104,200 on the hourly chart of the BTC/USD pair. Bitcoin is now trading above $104,500 and the 100 hourly Simple moving average.
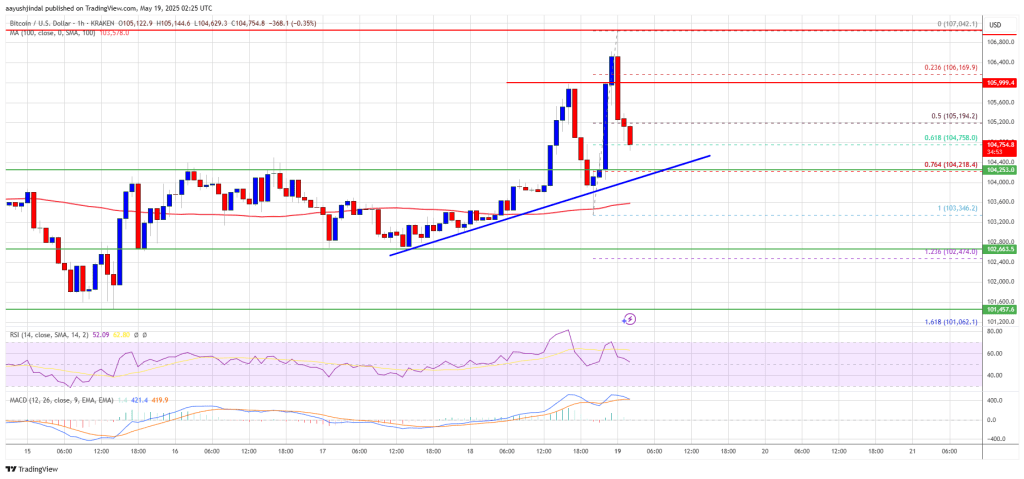
On the upside, immediate resistance is NEAR the $105,500 level. The first key resistance is near the $106,000 level. The next key resistance could be $107,500. A close above the $107,500 resistance might send the price further higher. In the stated case, the price could rise and test the $108,800 resistance level. Any more gains might send the price toward the $110,000 level and a new all-time high.
Another Decline In BTC?
If bitcoin fails to rise above the $105,500 resistance zone, it could start another correction. Immediate support on the downside is near the $104,500 level. The first major support is near the $104,200 level and the trend line.
The next support is now near the $103,500 zone. Any more losses might send the price toward the $102,200 support in the near term. The main support sits at $100,500, below which BTC might gain bearish momentum.
Technical indicators:
Hourly MACD – The MACD is now losing pace in the bullish zone.
Hourly RSI (Relative Strength Index) – The RSI for BTC/USD is now above the 50 level.
Major Support Levels – $104,200, followed by $103,500.
Major Resistance Levels – $105,500 and $106,000.
