Solana Roars Back: Capital Floodgates Reopen as Traders Pile In

After months of sideways action, Solana’s price pumps as on-chain data shows fresh money entering the ecosystem. The ’Ethereum killer’ narrative gets a second wind—just as Wall Street starts recycling its ’blockchain not Bitcoin’ talking points again.
Key drivers: Institutional inflows tick up while retail FOMO lurks. SOL’s technical breakout suggests traders are betting on a run toward previous highs. Meanwhile, Ethereum gas fees hit ’absurd’ levels again—handing Solana’s speed narrative another win.
Cynic’s corner: Funny how ’institutional adoption’ always seems to arrive right when hedge funds need exit liquidity.
Renewed Demand And Key Resistance Define Next Move
Solana is currently trading above a critical demand zone, showing strength as it holds firmly above the $170 level. However, to confirm the continuation of a sustained bullish rally, SOL must break and close decisively above the $185 resistance level. This region has acted as a strong ceiling in recent price action, and reclaiming it WOULD likely unlock the momentum needed for further gains.
The current rally across the broader crypto market, including Bitcoin and Ethereum, has fueled optimism that a larger bullish phase may be underway. For Solana, this could mark the start of a powerful trend reversal after months of volatility and uncertainty. Importantly, on-chain data supports this bullish case.
According to Glassnode, Solana has reversed its negative realized cap flows, with its 30-day capital inflows now back in positive territory. These inflows are growing at a rate of approximately 4–5%, comparable to what is currently being observed in XRP.
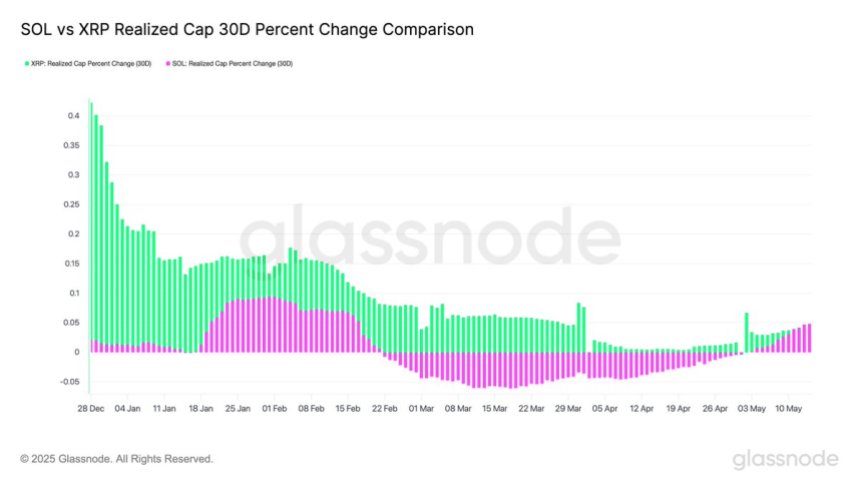
This shift signals a return of investor confidence and renewed demand within the Solana ecosystem. Such metrics are critical, as they reflect actual capital commitments rather than just speculative sentiment. If momentum continues and SOL reclaims the $185 level, it could trigger an aggressive breakout and lead the altcoin sector higher.
The next few days will be crucial for Solana. Holding above support while attempting to break resistance could define the structure of the next major move. A successful push higher would support the idea that Solana is not only recovering but potentially leading the next phase of altcoin expansion. Traders and investors alike are watching closely as this key test unfolds.
Solana Finds Support Above 200-EMA But Faces Resistance Near $181
Solana is currently trading at $170.48 after a sharp pullback from the recent local high NEAR $184. As shown on the chart, the price briefly pushed above both the 200-day EMA ($162.21) and SMA ($181.16), two key technical indicators closely watched by traders. This move signaled strength but was quickly met with selling pressure just below a significant resistance zone near the $185 level — the same region where multiple failed attempts have occurred in the past.
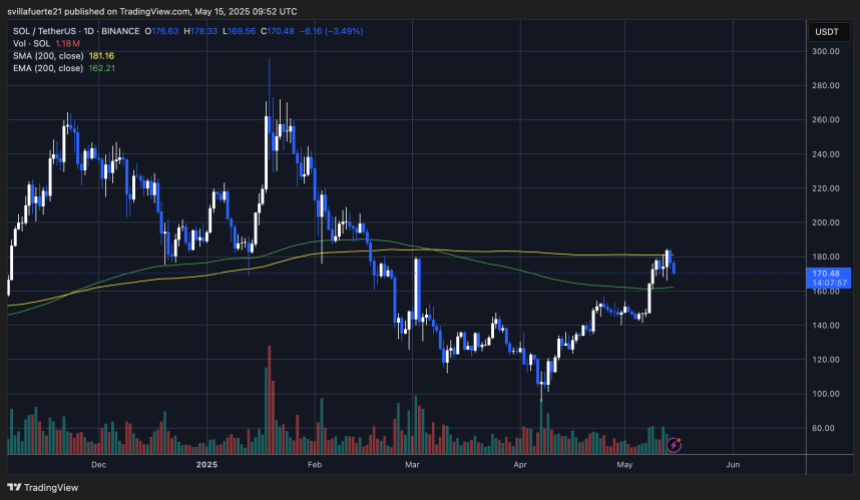
Despite the recent 3.5% daily drop, the price action remains bullish as long as SOL holds above the 200EMA. The higher low structure remains intact, and the recent retrace could be viewed as a healthy consolidation if bulls defend this range. A sustained MOVE above the 200SMA at $181.16 would likely trigger a fresh wave of bullish momentum and open the door for a push toward the $200-$220 area.
Volume remains elevated, suggesting active participation, though a drop in buying interest may signal caution. If the $162 zone fails to hold, a deeper retrace toward $150 is possible. For now, all eyes are on whether SOL can reclaim $181 with strength and set the stage for a sustained breakout.
Featured image from Dall-E, chart from TradingView

Log in to Reply
Log in to comment your thoughtsComments
Related Articles
|Square
Get the BTCC app to start your crypto journey
Get started today Scan to join our 100M+ users