XRP Defies Dip—Bulls Dig In as Support Holds Strong

XRP’s price stumbles but doesn’t collapse—traders are treating this pullback like a Black Friday sale on digital optimism.
Key levels hold: The 2025 bull run isn’t surrendering without a fight. Watch for institutional money playing ’catch-up’ with retail gamblers—as usual.
Bottom line: Until support cracks, this is just another ’healthy correction’ in crypto’s never-ending rollercoaster. (And if it drops further? Well, ’fundamentals’ never stopped a true believer.)
XRP Price Corrects Some Gains
XRP price remained supported above the $2.420 level and started a fresh upward wave, like Bitcoin and Ethereum. The price was able to surpass the $2.50 and $2.550 levels.
The bulls pushed the price above the $2.60 resistance zone. Finally, it tested the $2.650 zone. A high was formed at $2.650 before there was a pullback. The price dipped below $2.550 and the 50% Fib retracement level of the upward MOVE from the $2.4220 swing low to the $2.650 high.
Besides, there was a break below a key bullish trend line with support at $2.550 on the hourly chart of the XRP/USD pair. The price is now trading above $2.50 and the 100-hourly Simple Moving Average.
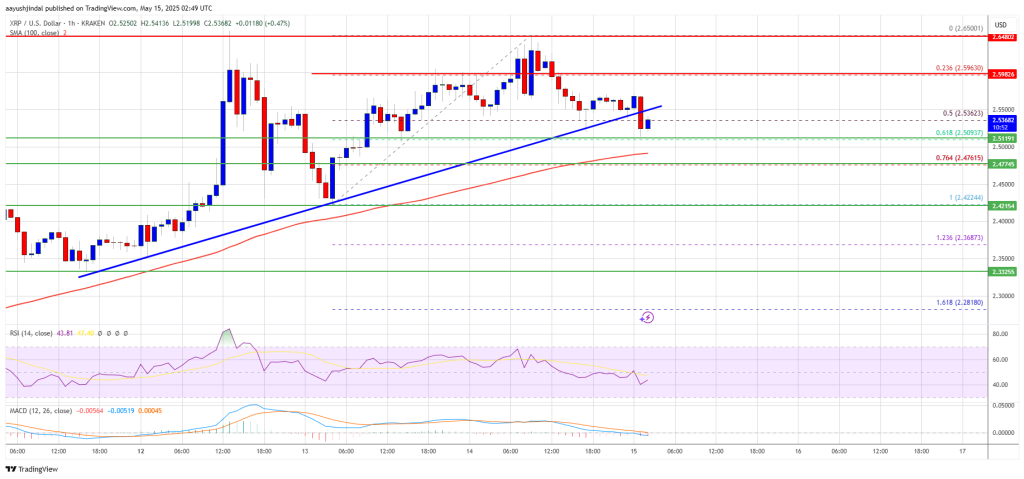
On the upside, the price might face resistance near the $2.550 level. The first major resistance is near the $2.580 level. The next resistance is $2.60. A clear move above the $2.60 resistance might send the price toward the $2.650 resistance. Any more gains might send the price toward the $2.720 resistance or even $2.750 in the near term. The next major hurdle for the bulls might be $2.880.
More Losses?
If XRP fails to clear the $2.580 resistance zone, it could start another decline. Initial support on the downside is near the $2.510 level and the 61.8% Fib retracement level of the upward move from the $2.4220 swing low to the $2.650 high. The next major support is near the $2.480 level.
If there is a downside break and a close below the $2.480 level, the price might continue to decline toward the $2.450 support. The next major support sits near the $2.420 zone.
Technical Indicators
Hourly MACD – The MACD for XRP/USD is now losing pace in the bullish zone.
Hourly RSI (Relative Strength Index) – The RSI for XRP/USD is now below the 50 level.
Major Support Levels – $2.510 and $2.480.
Major Resistance Levels – $2.60 and $2.650.

Log in to Reply
Log in to comment your thoughtsComments
Related Articles
|Square
Get the BTCC app to start your crypto journey
Get started today Scan to join our 100M+ users