XRP Defies Gravity—Analysts Eye Breakout as Bulls Take Control

Ripple’s XRP stages a relentless rally—up 18% this week alone—as traders pile into what’s fast becoming the crypto dark horse.
Why the surge? Institutional whales are circling, regulatory clouds are parting, and retail FOMO is kicking in hard. Even the usual ’sell the news’ crowd is holding tight after last month’s SEC settlement.
Key levels to watch: A clean break above $0.75 could trigger algorithmic buying frenzies. Meanwhile, crypto skeptics mutter about ’greater fool theory’ between sips of their overpriced artisanal coffee.
Bottom line: This isn’t 2017’s mindless hype. With real-world payment rails going live and CEX volumes spiking, XRP’s climb looks less like speculation and more like a market finally pricing utility. Whether Wall Street’s dinosaurs admit it or not.
XRP Price Regains Traction
XRP price remained supported above the $2.40 level and started a fresh upward wave, like Bitcoin and Ethereum. The price was able to surpass the $2.50 and $2.550 levels.
The bulls pushed the price above the $2.580 resistance zone to set the pace for more gains. Finally, it tested the $2.60 zone. A high was formed at $2.6050 before there was a pullback. The price dipped below $2.5650 and the 23.6% Fib retracement level of the upward MOVE from the $2.4220 swing low to the $2.6050 high.
The price is now trading above $2.50 and the 100-hourly Simple Moving Average. There is also a key bullish trend line forming with support at $2.510 on the hourly chart of the XRP/USD pair.
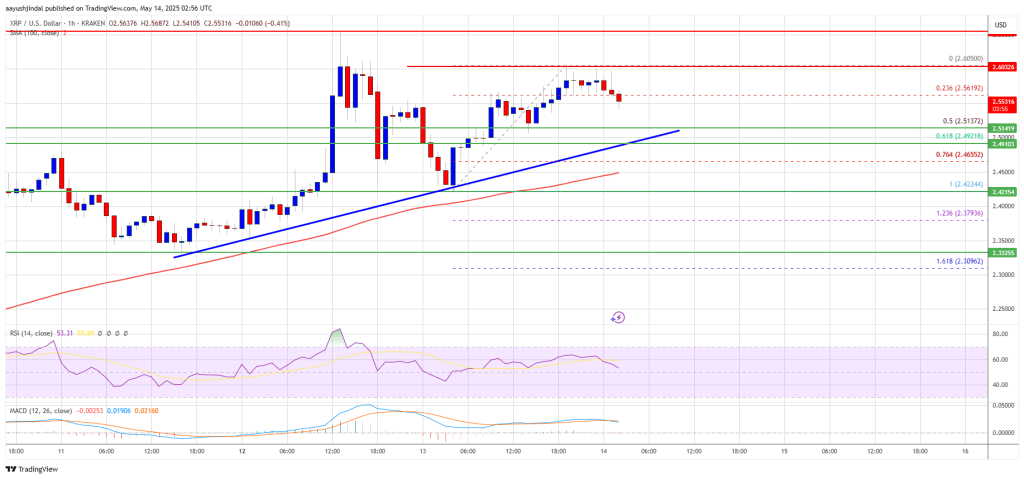
On the upside, the price might face resistance NEAR the $2.60 level. The first major resistance is near the $2.650 level. The next resistance is $2.720. A clear move above the $2.720 resistance might send the price toward the $2.80 resistance. Any more gains might send the price toward the $2.850 resistance or even $2.880 in the near term. The next major hurdle for the bulls might be $2.950.
Downside Correction?
If XRP fails to clear the $2.60 resistance zone, it could start another decline. Initial support on the downside is near the $2.510 level and the trend line. The next major support is near the $2.492 level and the 61.8% Fib retracement level of the upward move from the $2.4220 swing low to the $2.6050 high.
If there is a downside break and a close below the $2.4920 level, the price might continue to decline toward the $2.450 support. The next major support sits near the $2.420 zone.
Technical Indicators
Hourly MACD – The MACD for XRP/USD is now gaining pace in the bullish zone.
Hourly RSI (Relative Strength Index) – The RSI for XRP/USD is now above the 50 level.
Major Support Levels – $2.510 and $2.4920.
Major Resistance Levels – $2.60 and $2.650.

Log in to Reply
Log in to comment your thoughtsComments
Related Articles
|Square
Get the BTCC app to start your crypto journey
Get started today Scan to join our 100M+ users