Bitcoin Stalls as Ethereum Charges Ahead—Who’s Leading the Next Rally?

Bitcoin’s price action hits snooze while ETH steals the spotlight with bullish momentum. Traders yawn at BTC’s sideways grind—another classic ’store of value’ nap—as Ethereum’s gas fee circus fuels the march upward.
Key drivers: ETH’s deflationary burn and layer-2 adoption cut through market noise like a hot knife through institutional FUD.
Meanwhile, Bitcoin maximalists remind everyone they ’don’t care about price’ (while refreshing Blockfolio every 37 seconds). The real question: When the SEC finally approves that spot ETF, will Wall Street bankers still be calling it a ’Pet Rock 2.0’?
Bitcoin Price Consolidates Gains
Bitcoin price started a fresh increase from the $100,500 support zone. BTC formed a base and was able to clear the $102,000 resistance zone. The bulls even pushed the price above $103,200.
The pair spiked toward $105,000. A high was formed at $104,980 and the price is now correcting gains. There was a MOVE below the 23.6% Fib retracement level of the upward move from the $100,772 swing low to the $104,980 high.
Bitcoin is now trading above $103,500 and the 100 hourly Simple moving average. There is also a new connecting bullish trend line with support at $103,650 on the hourly chart of the BTC/USD pair.
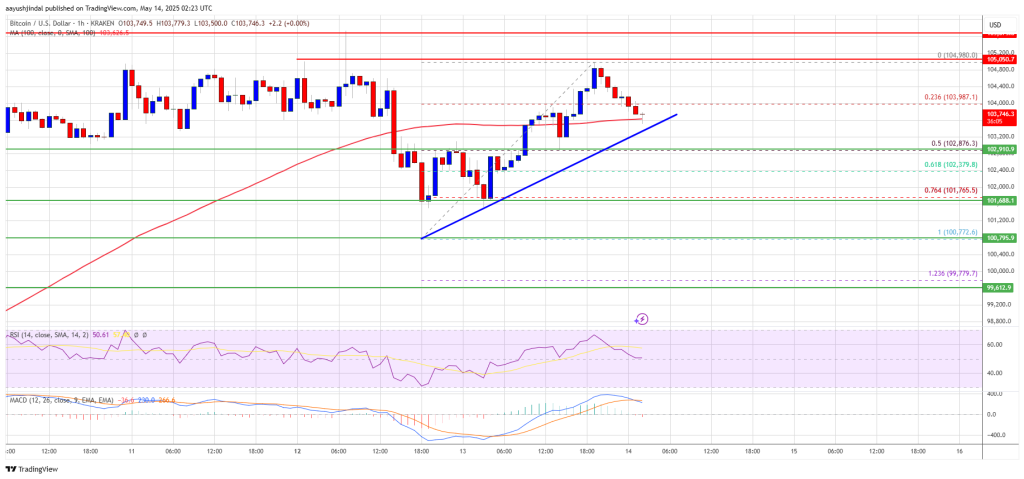
On the upside, immediate resistance is NEAR the $104,500 level. The first key resistance is near the $105,000 level. The next key resistance could be $105,500. A close above the $105,500 resistance might send the price further higher. In the stated case, the price could rise and test the $106,800 resistance level. Any more gains might send the price toward the $108,000 level.
More Losses In BTC?
If Bitcoin fails to rise above the $105,000 resistance zone, it could start another downside correction. Immediate support on the downside is near the $103,500 level. The first major support is near the $102,850 level and the 50% Fib retracement level of the upward move from the $100,772 swing low to the $104,980 high.
The next support is now near the $101,750 zone. Any more losses might send the price toward the $100,200 support in the near term. The main support sits at $98,800.
Technical indicators:
Hourly MACD – The MACD is now losing pace in the bullish zone.
Hourly RSI (Relative Strength Index) – The RSI for BTC/USD is now above the 50 level.
Major Support Levels – $103,500, followed by $102,850.
Major Resistance Levels – $105,000 and $105,500.
