Bitcoin Teeters on Edge of Explosive Rally—Here’s Why Traders Are Loading Up

After weeks of consolidation, Bitcoin’s price chart is printing the kind of technical patterns that make hedge fund managers sweat into their overpriced suits. The $60K support level just won’t die, and now liquidity is piling up at key resistance zones.
Breaking Through the Ceiling
A clean breakout above $67K could trigger algorithmic buying frenzies—those same bots that somehow lose money in bull markets. On-chain data shows whales accumulating at levels not seen since the 2021 cycle, while retail traders remain distracted by meme coins and celebrity crypto endorsements.
The institutional FOMO playbook is simple: wait for confirmation, then front-run the ETFs. Meanwhile, Bitcoin’s hash rate keeps hitting all-time highs—because nothing says ’store of value’ like a network burning more energy than Portugal.
This isn’t financial advice (obviously), but the charts are screaming one thing: the boring sideways action might be about to get very, very interesting.
Bitcoin Price Aims More Gains
Bitcoin price started a fresh increase from the $96,500 support zone. BTC formed a base and was able to clear the $98,800 resistance zone. The bulls even pushed the price above $102,000.
The pair spiked above $104,500 and tested $105,000. A high is formed at $104,943 and the price is now consolidating gains above the 23.6% Fib retracement level of the upward move from the $95,825 swing low to the $104,943 high.
Bitcoin is now trading above $103,500 and the 100 hourly Simple moving average. There is also a new connecting bullish trend line forming with support at $103,500 on the hourly chart of the BTC/USD pair.
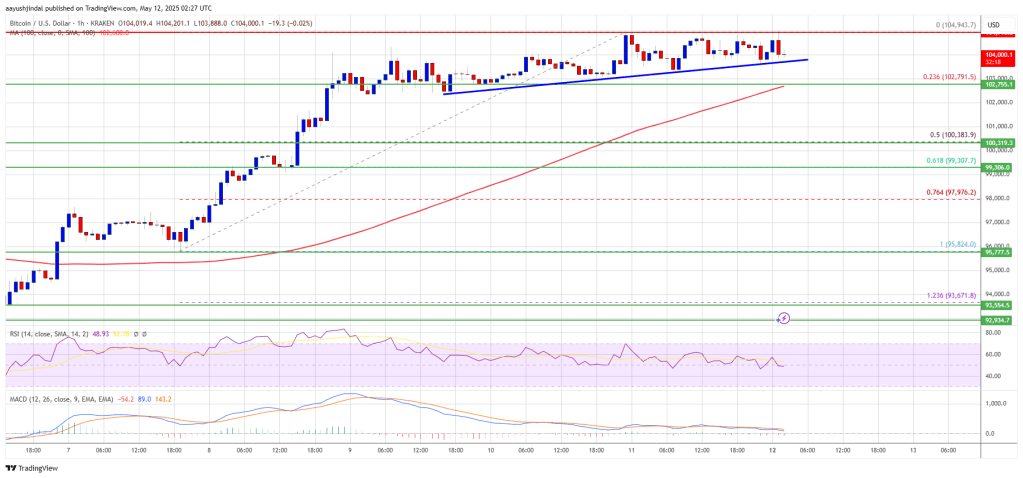
On the upside, immediate resistance is NEAR the $104,500 level. The first key resistance is near the $105,000 level. The next key resistance could be $105,500. A close above the $105,500 resistance might send the price further higher. In the stated case, the price could rise and test the $106,200 resistance level. Any more gains might send the price toward the $108,000 level.
Are Dips Supported In BTC?
If Bitcoin fails to rise above the $104,500 resistance zone, it could start another downside correction. Immediate support on the downside is near the $103,500 level and the trend line. The first major support is near the $102,800 level.
The next support is now near the $100,500 zone and the 50% Fib retracement level of the upward move from the $95,825 swing low to the $104,943 high. Any more losses might send the price toward the $98,800 support in the near term. The main support sits at $97,500.
Technical indicators:
Hourly MACD – The MACD is now gaining pace in the bullish zone.
Hourly RSI (Relative Strength Index) – The RSI for BTC/USD is now above the 50 level.
Major Support Levels – $103,500, followed by $102,800.
Major Resistance Levels – $104,500 and $105,000.
