Solana Charges Into Make-or-Break Zone – $180 Holds the Key to Its Next Big Move

Solana’s price surge isn’t just another crypto pump—it’s a high-stakes showdown at the $180 level. Bulls see a springboard to new highs; bears smell a classic ’buy the rumor, sell the news’ trap.
Why $180 matters: This isn’t just psychological resistance. It’s where SOL got wrecked in January’s correction. Break through, and sidelined money floods in. Fail, and we’re back to ’crypto winter’ memes.
Meanwhile, TradFi analysts suddenly care about blockchain speeds—but only after their hedge funds start loading up on SOL futures. Funny how that works.
Solana Approaches Pivotal Level As Bulls Eye Breakout
Solana is showing renewed strength after a clean breakout above the $160 resistance zone, a level that had capped price action for several weeks. The surge has brought SOL into a critical region that could act as a pivot point—either igniting a fresh bullish rally or marking a temporary top before a retrace.
As global tensions between the US and China and broader macroeconomic uncertainties linger, the crypto market remains exposed to sudden sentiment shifts. However, recent price action in Solana, along with Bitcoin and Ethereum, suggests that investors are increasingly optimistic about a continued market recovery.
Solana’s current structure reflects that optimism. The asset is now testing the underside of its daily 200 moving average, a level often viewed by traders as a trend-defining indicator. A successful push above this moving average WOULD add further confidence to the bullish thesis. At the same time, Solana is approaching a lower high near the $180 zone, where the price was previously rejected in March. Cheds points to this convergence as a crucial area: a breakout here could mark the beginning of a larger reversal pattern.
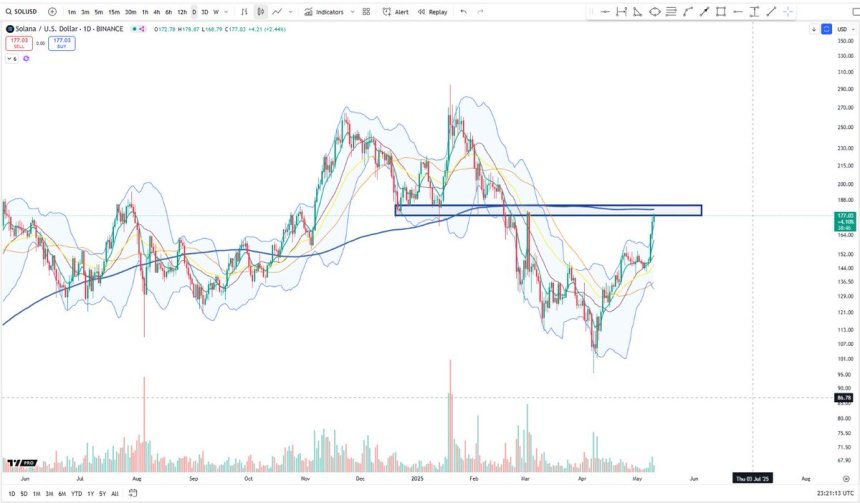
Still, risks remain. A rejection at the $180 level could reinforce resistance and trigger a pullback toward the $160 support, especially if macro conditions worsen or profit-taking sets in. For now, however, bulls appear to be in control, and the technical landscape supports a potential continuation—if momentum holds.
Technical Levels: Price Action Shows Strength
Solana (SOL) is exhibiting strong momentum as it trades at $176.41, advancing toward a crucial resistance area around the $180 level. The daily chart shows that SOL has surged rapidly from April lows, breaking above both the 200-day EMA ($161.67) and approaching the 200-day SMA ($181.10), a key area that could determine the next major trend.
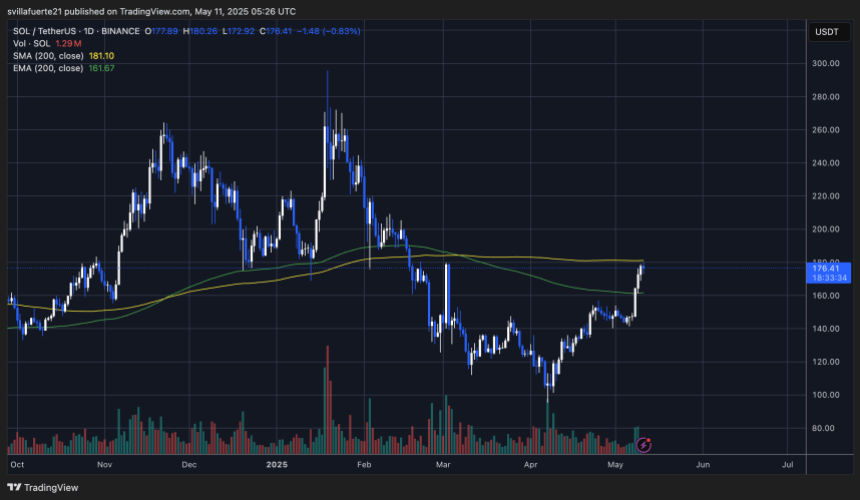
This zone acted as support and resistance multiple times in the past, particularly during Q4 2024 and early 2025. Now, as price returns to this range, it becomes a potential pivot point. If bulls can sustain pressure and close above $181.10 with volume confirmation, it may trigger a continuation toward $200 and possibly retest February highs above $260. However, failure to break above this range could prompt a rejection and consolidation below the 200 SMA.
Volume has picked up significantly over the last few days, indicating rising interest and participation from traders. This is a constructive sign as Solana attempts to reclaim higher ground. For now, the trend remains bullish, but eyes are on the $180–$185 resistance zone to confirm whether SOL has the strength to continue its breakout or faces a short-term pullback.
Featured image from Dall-E, chart from TradingView

Log in to Reply
Log in to comment your thoughtsComments
Related Articles
|Square
Get the BTCC app to start your crypto journey
Get started today Scan to join our 100M+ users