BNB Charges Toward $650 as Crypto Bulls Shake Off Bearish Sentiment

Binance Coin (BNB) surges past key resistance levels as traders bet on a return to all-time highs. The $650 target now in sight marks a 30% climb from current prices—fueled by spot market accumulation and suspiciously timed ’institutional interest’ reports.
Technical indicators flash bullish: RSI breaks out of oversold territory while exchange reserves hit 18-month lows. Retail FOMO meets whale accumulation in a classic pump setup.
Just don’t ask about the SEC’s ongoing investigation—today’s market only prices in hopium.
BNB Price Eyes More Gains
After forming a base above the $600 level, BNB price started a fresh increase. There was a move above the $605 and $612 resistance levels, like Ethereum and Bitcoin.
The bulls even pushed the price above the $625 level. A high was formed at $629 and the price is now consolidating gains above the 23.6% Fib retracement level of the recent wave from the $597 swing low to the $629 high.
The price is now trading above $622 and the 100-hourly simple moving average. There is also a key bullish trend line forming with support near $622 on the hourly chart of the BNB/USD pair.
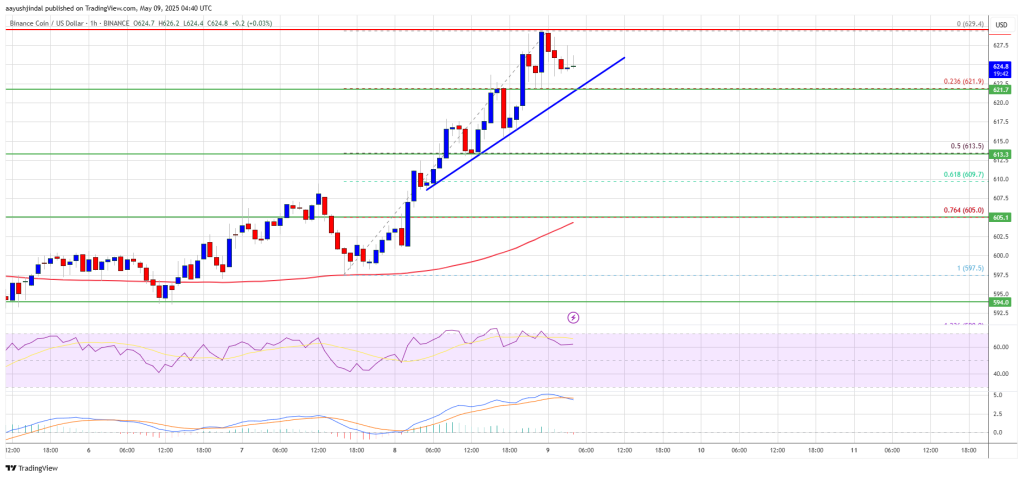
On the upside, the price could face resistance near the $628 level. The next resistance sits near the $630 level. A clear MOVE above the $630 zone could send the price higher. In the stated case, BNB price could test $642. A close above the $642 resistance might set the pace for a larger move toward the $650 resistance. Any more gains might call for a test of the $655 level in the near term.
Another Decline?
If BNB fails to clear the $630 resistance, it could start another decline. Initial support on the downside is near the $622 level. The next major support is near the $620 level.
The main support sits at $612 and the 50% Fib retracement level of the recent wave from the $597 swing low to the $629 high. If there is a downside break below the $612 support, the price could drop toward the $605 support. Any more losses could initiate a larger decline toward the $600 level.
Technical Indicators
Hourly MACD – The MACD for BNB/USD is gaining pace in the bullish zone.
Hourly RSI (Relative Strength Index) – The RSI for BNB/USD is currently above the 50 level.
Major Support Levels – $622 and $612.
Major Resistance Levels – $630 and $642.
