Bitcoin Hits a Wall: On-Chain Data Shows $100K Is the New Psychological Ceiling

Bitcoin’s march toward six figures just got complicated. Fresh on-chain metrics reveal massive sell orders stacking up at the $100,000 mark—turns out even crypto maximalists have price targets.
The resistance reality check
Whale wallets are prepping take-profit orders like Black Friday shoppers, with exchange inflow spikes suggesting a ’buy the rumor, sell the news’ mentality as we approach the big psychological barrier. Meanwhile, institutional traders are hedging like it’s 2021 all over again.
Breaking through or breaking down?
The last time BTC faced this much concentrated resistance was at its previous all-time high—and we all remember how that played out. This time, the market’s got more derivatives exposure than a Lehman Brothers fire sale. Will spot ETF flows power through the sell wall, or are we setting up for the mother of all gamma squeezes?
Either way, Wall Street’s latest ’digital gold’ narrative looks shakier than a balance sheet after repo market hours. Happy trading.
A Low Amount Of Bitcoin Supply Has Cost Basis At Levels Ahead
In a new post on X, institutional DeFi solutions provider Sentora (formerly IntoTheBlock) has discussed about how the various Bitcoin price ranges look in terms of investor cost basis as BTC approaches $100,000.
Below is a chart that shows the related data for the price ranges NEAR the latest spot value:
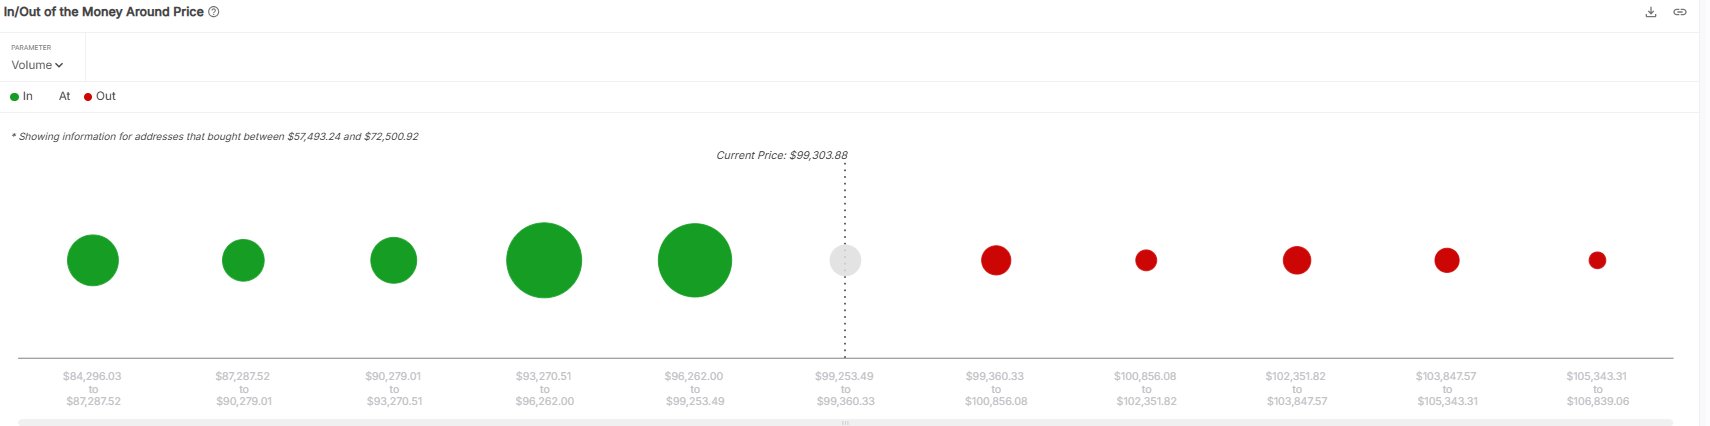
In the graph, the size of the dot corresponds to the amount of the bitcoin supply that investors last purchased inside the associated price range. It would appear that all the large dots are under the spot price following the latest rally, meaning that the levels that saw the most demand are now in the green.
It’s also visible that the ranges ahead (that is, those harboring the cost basis of underwater holders) have only small dots associated with them. In total, less than 3% of the cryptocurrency’s supply has its cost basis at these levels that lie above the spot price.
To any investor, their cost basis is an important level, so they may be more likely to show some kind of MOVE when a retest of it happens. Generally, holders who were in the loss prior to this retest might incline toward reacting to it by selling their coins. This is because these investors may fear going back into loss again.
Similarly, the profit investors could decide to buy more during a retest of their acquisition mark, believing that the same level might end up being profitable again in the future.
These buying and selling behaviors are naturally of no consequence to Bitcoin when only a few investors are showcasing them. Tight price ranges where a large amount of investors share their cost basis, however, can produce a reaction sizeable enough to affect the asset.
Clearly, Bitcoin only has such ranges left on the profit side, implying it has no major resistance levels ahead in terms of supply distribution. Thus, an exploration beyond $100,000 may not be hindered by break-even sellers.
Though, while this may true, the run could have something different to worry about: profit-selling. Usually, the more investors are there in gains, the more likely is a mass selloff to occur.
With the vast majority of the Bitcoin supply now in the green, it’s possible that profit-taking WOULD become a threat to the rally. It only remains to be seen whether there would be enough incoming demand able to absorb the potential selling pressure or not.
BTC Price
At the time of writing, Bitcoin is trading around $99,400, up more than 3% in the last week.
