Solana (SOL) Braces for More Pain—Market Signals Point to Extended Downtrend

Solana’s SOL token keeps getting hammered—technical indicators flash red as traders brace for deeper losses. The ’Ethereum killer’ now faces its own execution risks.
Blood in the streets? Not yet. But the charts suggest SOL hasn’t found its floor. A mix of macroeconomic jitters and chain-specific congestion issues keep buyers sidelined.
Remember: In crypto, the ’buy the dip’ crowd always shows up late to their own funerals. Proceed with caution—and maybe keep some dry powder for the real bottom.
Solana Price Consolidates Gains
Solana price formed a base above the $142 support and started a fresh increase, like Bitcoin and Ethereum. SOL gained pace for a move above the $145 and $150 resistance levels.
However, the bears were active below the $155 resistance zone. A high was formed at $153.90 and the price started a fresh decline. The price dipped below $150 and $148. A low was formed at $142.64 and the price is now consolidating losses.
There was a minor move above the 23.6% Fib retracement level of the downward move from the $153.90 swing high to the $142.64 low. Solana is now trading below $150 and the 100-hourly simple moving average. There is also a short-term rising channel or a continuation pattern forming with support at $144 on the hourly chart of the SOL/USD pair.
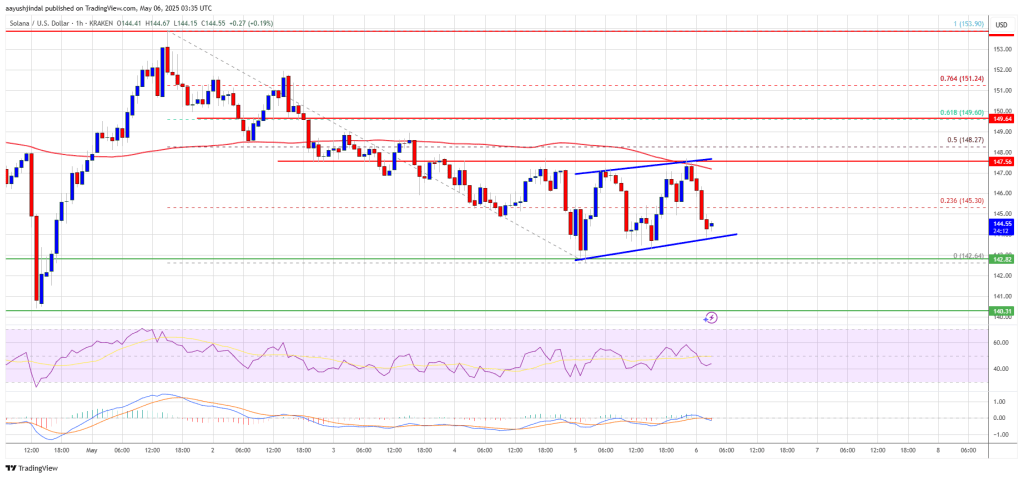
On the upside, the price is facing resistance NEAR the $147 level. The next major resistance is near the $150 level and the 61.8% Fib retracement level of the downward move from the $153.90 swing high to the $142.64 low. The main resistance could be $155. A successful close above the $155 resistance zone could set the pace for another steady increase. The next key resistance is $165. Any more gains might send the price toward the $180 level.
More Losses in SOL?
If SOL fails to rise above the $150 resistance, it could start another decline. Initial support on the downside is near the $145 zone. The first major support is near the $142 level.
A break below the $142 level might send the price toward the $135 zone. If there is a close below the $135 support, the price could decline toward the $122 support in the near term.
Technical Indicators
Hourly MACD – The MACD for SOL/USD is gaining pace in the bearish zone.
Hourly Hours RSI (Relative Strength Index) – The RSI for SOL/USD is below the 50 level.
Major Support Levels – $145 and $142.
Major Resistance Levels – $147 and $150.
