XRP Revisits 2017’s Infamous Price Threshold—The Same One That Triggered a 20x Parabolic Rally

History doesn’t repeat, but it often rhymes—especially in crypto. XRP’s chart is flashing a technical signal not seen since its 2017 moonshot, when retail FOMO turned a sleepy token into a +2,000% rocket. Cue the ’when lambo’ memes.
The setup? A decisive break above the 200-week moving average—the same trendline that previously acted as launchpad for XRP’s absurd bull run. This time, though, the macro environment’s a minefield: inflation data looming, ETF flows stalling, and the usual suspects screaming ’this time it’s different.’
Will history repeat? Maybe. But remember—even broken clocks are right twice a day, and crypto’s packed with horologists selling hopium. Proceed with caution (and maybe a trailing stop).
Technical Pattern Shows Clear Breakout Structure On 2-Month Timeframe
Technical analysis of XRP’s price action on the 2-month candlestick timeframe chart shows that the cryptocurrency is still trading in a bullish setup on a larger timeframe. This analysis, shared by crypto analyst JD on social media platform X, shows XRP breaking out from a long-term triangle pattern, which has held its price in consolidation since the 2018 peak.
The structure formed by this triangle includes a flat resistance trendline at the top and a gradually rising trendline at the bottom. XRP’s price performance in late 2024 saw it break above the upper resistance trendline, much like it did in a similar setup in the first few months of 2017.
Notably, the XRP price broke above this trendline with conviction, which allowed it to reach a multi-year high of $3.3. However, the ensuing price action has been corrections upon corrections, with XRP now trading close to the $2 price level.
Notwithstanding, the appearance of a bullish cross on the RSI means a bullish setup is still in action, with crypto analyst JD highlighting a potential 20x surge.
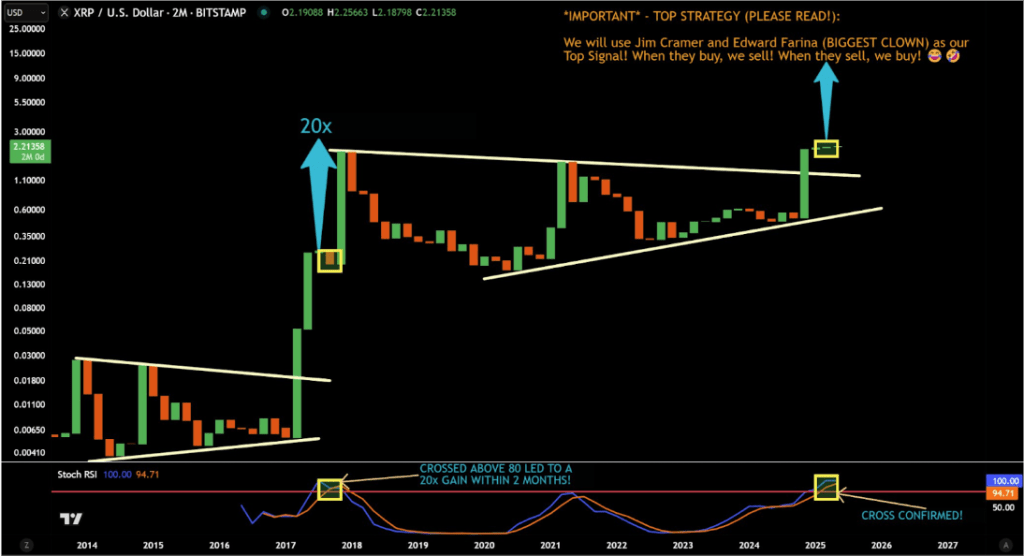
Stochastic RSI Cross Above 80: The Same Spark From 2017
The appearance of a cross on the Stochastic RSI above the 80 level makes the current bullish setup more convincing. JD pointed out that the last time this crossover happened was in 2017, right before XRP recorded a 20x gain within three months.

His chart illustrates this visually, showing a yellow highlight at the intersection point of the SRSI lines during that historic breakout. The same cross has now been confirmed on the 2-month chart.
The SRSI cross occurs when the %K line crosses above or below the %D line within the Stochastic RSI indicator. In the case of XRP, the bullish signal of the cross is examined above the 80 threshold on the 2-month chart. The last time this happened in 2017, XRP went on a rally over four months from around $0.15 until it reached its current all-time high of $3.40.
If a similar scenario were to unfold, this would put the target around $45. This may seem unrealistic, considering the inflows needed to reach this level. Nonetheless, a rally from the recent SRSI cross could send the XRP price to new all-time highs.
At the time of writing, XRP is trading at $2.2.
Featured image from Unsplash, chart from TradingView

Log in to Reply
Log in to comment your thoughtsComments
Related Articles
|Square
Get the BTCC app to start your crypto journey
Get started today Scan to join our 100M+ users