XRP Teeters at Critical 100 SMA—Breakout May Spark Price Frenzy

Ripple’s XRP dances on a knife’s edge as traders eye the 100-day Simple Moving Average—a breach could send bulls stampeding.
Technical tension mounts: The 100 SMA has historically acted as both springboard and trapdoor for XRP’s volatile price action. This time? Market whispers suggest institutional players are stacking bids just below current levels.
Meanwhile, crypto’s usual suspects (looking at you, ’stablecoin’ issuers) keep printing synthetic dollars to prop up the entire circus—because nothing says ’decentralized’ like centralized mints working overtime.
XRP Price Eyes Fresh Surge
XRP price remained supported above $2.125 and started a decent increase, but it lagged Bitcoin and Ethereum. The price was able to surpass the $2.150 and $2.20 resistance levels.
There was a move above the 23.6% Fib retracement level of the downward move from the $2.359 swing high to the $2.1250 low. Besides, there was a break above a connecting bearish trend line with resistance near $2.2350 on the hourly chart of the XRP/USD pair.
The price is now trading below $2.250 and the 100-hourly Simple Moving Average. On the upside, the price might face resistance near the $2.250 level. The first major resistance is near the $2.30 level and 76.4% Fib retracement level of the downward move from the $2.359 swing high to the $2.1250 low.
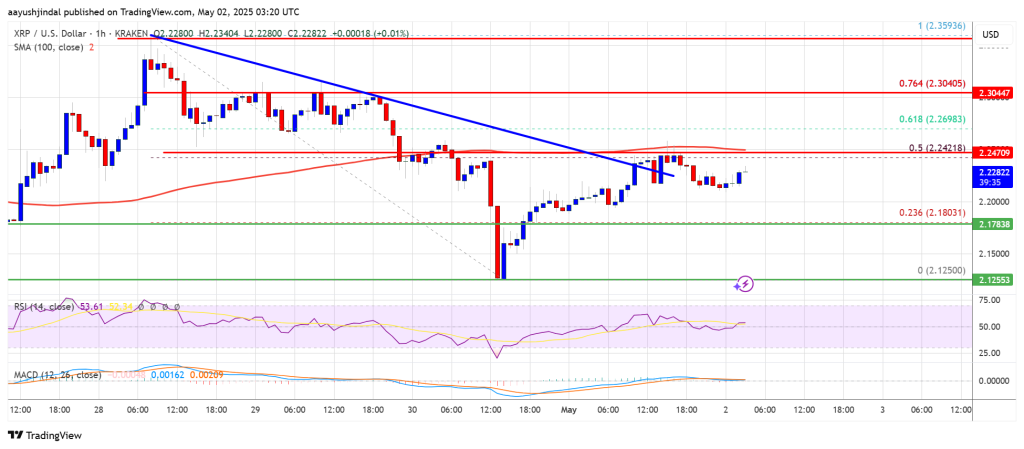
The next resistance is $2.350. A clear move above the $2.350 resistance might send the price toward the $2.420 resistance. Any more gains might send the price toward the $2.450 resistance or even $2.50 in the near term. The next major hurdle for the bulls might be $2.650.
Dips Supported?
If XRP fails to clear the $2.250 resistance zone, it could start another decline. Initial support on the downside is near the $2.20 level. The next major support is near the $2.180 level.
If there is a downside break and a close below the $2.180 level, the price might continue to decline toward the $2.120 support. The next major support sits near the $2.050 zone.
Technical Indicators
Hourly MACD – The MACD for XRP/USD is now gaining pace in the bullish zone.
Hourly RSI (Relative Strength Index) – The RSI for XRP/USD is now above the 50 level.
Major Support Levels – $2.20 and $2.120.
Major Resistance Levels – $2.250 and $2.30.
