Bitcoin Smashes Resistance—$100K Beckons as Bulls Take Control

BTC’s breakout just got the green light—traders are now laser-focused on the next psychological battleground. Here’s what’s fueling the rally (and why Wall Street’s late to the party... again).
The technical playbook: Bitcoin sliced through key resistance like a hot knife through institutional FUD. On-chain data shows whales accumulating at levels last seen before the 2021 bull run.
Macro tailwinds: With the Fed’s pivot looking increasingly desperate, crypto’s proving it doesn’t need cheap money to moon—just ask the bagholders still waiting for their ’risk-free’ 5% Treasury yields.
What’s next: All eyes on the $100K marker. A clean break here could trigger the mother of all short squeezes—and another round of ’expert’ price predictions that’ll age like milk.
Bitcoin Price Regains Momentum
Bitcoin price formed a base above the $93,500 level. BTC started a fresh increase and was able to clear the $95,500 resistance zone to set the pace for a larger increase.
The bulls even pushed the price above the $96,500 resistance. A high was formed at $97,405 and the price is now consolidating gains. There was a minor decline below the $97,000 level and the price tested the 23.6% Fib retracement level of the upward move from the $92,970 swing low to the $97,405 high.
Bitcoin price is now trading above $95,000 and the 100 hourly Simple moving average. There is also a connecting bullish trend line forming with support at $96,350 on the hourly chart of the BTC/USD pair.
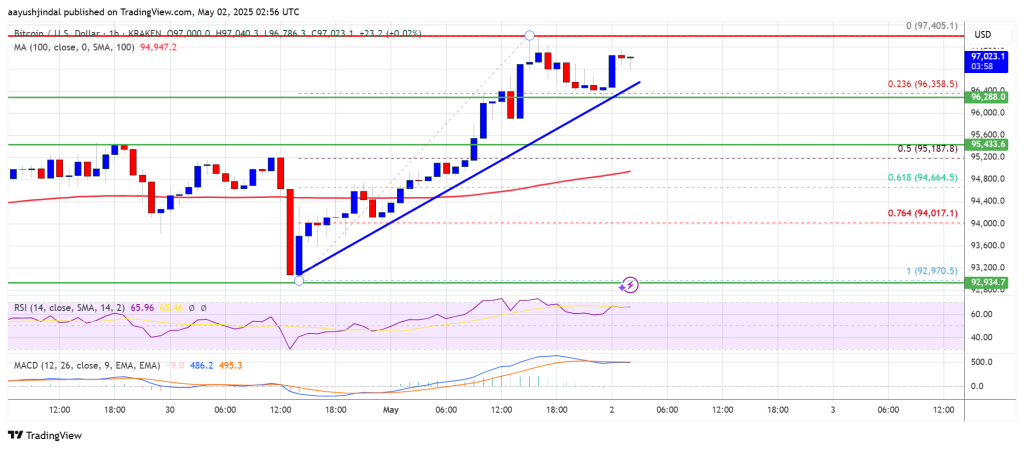
On the upside, immediate resistance is NEAR the $97,200 level. The first key resistance is near the $97,400 level. The next key resistance could be $97,500. A close above the $97,500 resistance might send the price further higher. In the stated case, the price could rise and test the $98,800 resistance level. Any more gains might send the price toward the $100,000 level.
Another Decline In BTC?
If Bitcoin fails to rise above the $97,500 resistance zone, it could start another downside correction. Immediate support on the downside is near the $96,500 level and the trend line. The first major support is near the $96,000 level.
The next support is now near the $95,200 zone and the 50% Fib retracement level of the upward move from the $92,970 swing low to the $97,405 high. Any more losses might send the price toward the $94,500 support in the near term. The main support sits at $94,200.
Technical indicators:
Hourly MACD – The MACD is now gaining pace in the bullish zone.
Hourly RSI (Relative Strength Index) – The RSI for BTC/USD is now above the 50 level.
Major Support Levels – $96,500, followed by $95,500.
Major Resistance Levels – $97,500 and $98,000.
