Bitcoin Bulls Charge Toward $95K—Is This the Start of a New Mega-Rally?

Crypto traders are loading up on BTC futures as derivatives data flashes the most bullish signals since 2021. Whispers of a ’supply shock’ grow louder—thanks to spot ETF demand and the halving’s chokehold on new coins.
Technical breakout or trap? The $69K all-time high just got smashed, but skeptics point to over-leveraged longs. ’Same playbook as last cycle,’ mutters one hedge fund manager while secretly FOMO-buying.
Wall Street’s latest crypto pivot? Suddenly everyone’s a ’blockchain analyst’ after ignoring BTC for a decade. How convenient.
Bitcoin Price Eyes Fresh Rally
Bitcoin price started a short-term downside correction from the $95,250 resistance zone. BTC declined below the $95,000 and $94,500 support levels.
The bears pushed the price below the $93,500 support. However, the bulls were active NEAR the $93,000 support. A low was formed at $92,970 and the price started a fresh increase. There was a move above the $93,500 and $93,800 resistance levels.
The price climbed above the 50% Fib retracement level of the downward move from the $95,195 swing high to the $92,970 low. Bitcoin price is now trading above $94,000 and the 100 hourly Simple moving average.
The price is also above the 76.4% Fib retracement level of the downward move from the $95,195 swing high to the $92,970 low. On the upside, immediate resistance is near the $95,000 level. There is also a connecting bearish trend line forming with resistance at $95,000 on the hourly chart of the BTC/USD pair.
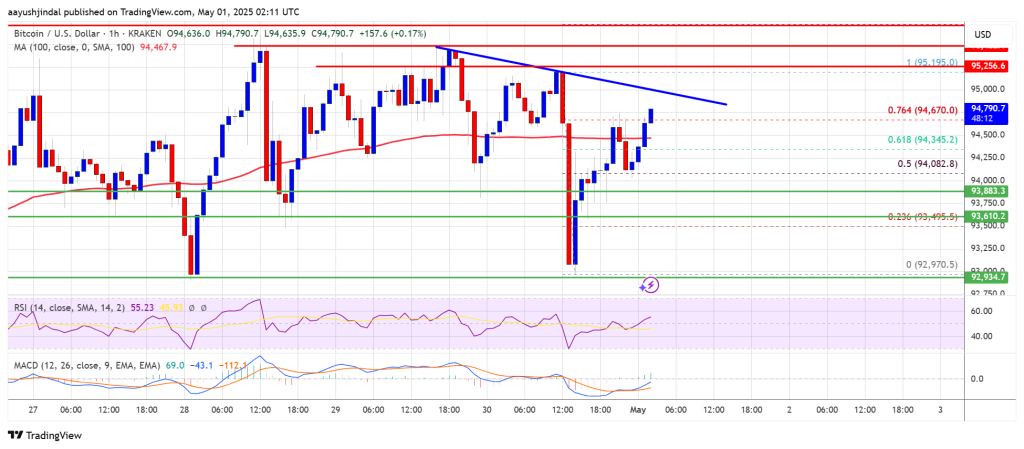
The first key resistance is near the $95,250 level. The next key resistance could be $95,500. A close above the $95,500 resistance might send the price further higher. In the stated case, the price could rise and test the $96,500 resistance level. Any more gains might send the price toward the $98,000 level.
Another Decline In BTC?
If Bitcoin fails to rise above the $95,500 resistance zone, it could start another downside correction. Immediate support on the downside is near the $94,200 level. The first major support is near the $93,500 level.
The next support is now near the $93,000 zone. Any more losses might send the price toward the $92,500 support in the near term. The main support sits at $91,200.
Technical indicators:
Hourly MACD – The MACD is now gaining pace in the bullish zone.
Hourly RSI (Relative Strength Index) – The RSI for BTC/USD is now above the 50 level.
Major Support Levels – $94,500, followed by $93,500.
Major Resistance Levels – $95,250 and $95,500.

Log in to Reply
Log in to comment your thoughtsComments
Related Articles
|Square
Get the BTCC app to start your crypto journey
Get started today Scan to join our 100M+ users