Polygon Primed for 100% Rally as Wedge Pattern Nears Breakout

Polygon’s MATIC is flashing a textbook bullish signal—a broadening wedge pattern that historically precedes major upside. Traders are eyeing a potential double-digit surge if key resistance cracks.
Technical setup screams accumulation. The weeks-long consolidation has tightened like a spring, with volume drying up just before today’s 7% pop. Chartists whisper ’2x incoming’ as the pattern mirrors Q1 2023’s run-up.
But here’s the kicker: this rally would still leave MATIC 60% below its ATH. Maybe this time Wall Street’s ’blockchain experts’ won’t dump their bags at the first sign of green.
From Consolidation To Acceleration: Polygon Phase Shifts
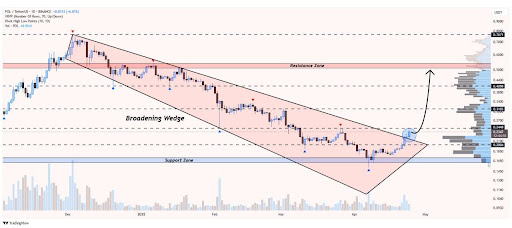
In a recent tweet, Whales_Crypto_Trading highlighted a significant technical move on POL’s chart. Polygon is currently breaking above the upper boundary of a broadening wedge on the daily timeframe, which is usually a bullish signal that points to rising volatility and potential trend reversal. This pattern, widely watched by technical traders, suggests that POL may be gearing up for a sustained upside push.
The analyst further noted that if momentum continues to build, POL could see a notable move toward the $0.52 mark. This level represents a midterm projection based on the size of the breakout from the wedge formation. A 2x gain from current levels would attract bullish attention and position POL back in line with previous consolidation zones.
With the breakout accompanied by improving sentiment and growing volume, Polygon appears to be setting the stage for a stronger rally. Presently, speculations are whether bulls can maintain the price above the breakout level and continue defending short-term support. If that happens, POL’s next chapter could be defined by renewed momentum and wider investor interest.
Measured Moves And Extended Targets
While $0.31 stands as the immediate upside target following the breakout, the broadening wedge pattern hints that the Polygon rally may not stop there. Breakouts from such structures often extend beyond initial resistance zones, especially when supported by strong volume and positive momentum indicators.
If bullish pressure remains steady, the next areas to watch would be NEAR $0.44 and $0.52, both of which align with previous reaction points and Fibonacci extensions. These levels could act as zones where short-term traders might take profits, but they also offer opportunities for the trend to build new higher highs.
Despite the upward momentum surrounding POL’s breakout, risks still linger beneath the surface. One major concern is the possibility of a false breakout if the price fails to hold above the $0.31 mark, attracting strong selling pressure and trapping late buyers. This would invalidate the breakout and may trigger a swift pullback toward lower support levels.
